Download
1 / 57
620 likes | 826 Views
Biological Network Analysis: Metabolic Optimization Methods. Tomer Shlomi Winter 2008. Linear Programming. c, l, A, b, α , β are parameters Problem may be either feasible or infeasible If the problem has an unique optimal value: It may either have a single optimal solution

E N D
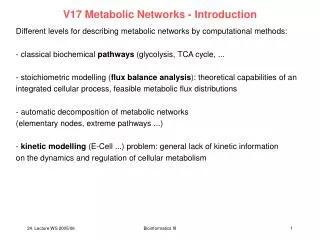
Biological Network Analysis:Metabolic Optimization Methods Tomer Shlomi Winter 2008
Linear Programming • c, l, A, b, α, β are parameters • Problem may be either feasible or infeasible • If the problem has an unique optimal value: • It may either have a single optimal solution • Or a space of optimal solutions • Alternatively, the problem may be unbounded
Flux Balance Analysis • Searches for a steady-state flux distribution v: S∙v=0 • Satisfying thermodynamic and capacity constraints: vmin≤v ≤vmax • With maximal growth rate Max vbiomass
Lecture Outline 1. Growth rate predictions Phenotypic Phase Plane (PPP) analysis 2. Gene knockout lethality predictions FBA Minimization of Metabolic Adjustment (MOMA) Regulatory On/Off Minimization (ROOM) 3. Predicting knockout strategy for metabolic production OptKnock OptStrain 4. Gene function prediction
Flux Balance Analysis (reminder) • Searches for a steady-state flux distribution v with maximal growth rate: Max vbiomass S∙v=0 vmin≤v ≤vmax • Requires bounds on metabolite uptake rates (b1)
Phenotype Phase Planes (PPP) (I) X axis – Succinate uptake rate Y axis – Oxygene uptake rate Z axis - Growth rate (maximal value of the objective function as function of succinate and oxygen uptake) Line of optimality
Phenotype Phase Planes (PPP) (II) Schilling 2001 • Observations: • Metabolic network is unable to utilize succinate as sole carbon source in anaerobic conditinos. • Region 1: oxygen excess – this region is wasteful – (less carbon is available for biomass production since it is oxidized to eliminate the excess oxygen.) Growth rate Oxygene Succinate • Region 3- the uptake of additional succinate has a negative effect. Cellular resources are required to eliminate excessive succinate.
Does E. coli behave according to Phenotype Phase Planes? (I) • E. coli was grown with malate as sole carbon source. • A range of substrate concentrations and temperatures were used in order to vary the malate uptake rate (MUR). • Oxygen uptake rate (OUR) and growth rate were measured
Does E. coli behave according to Phenotype Phase Planes? (II) Malate/oxygen PPP The experimentally determined growth rate were on the line of optimality of the PPP ! Ibarra et al., Nature 2002
Does E. coli behave according to Phenotype Phase Planes? (III) Same experiments were made using glycerol as sole carbon source Day 0 – Sub optimal growth Why? Day 1-40 – evolution toward optimal growth Day 40 –optimal growth Day 60 –optimal growth (no change)
Predicting Knockout Lethality (I) • A gene knockout is simulated by setting the flux through the corresponding reaction to zero • The corresponding reactions are identified by evaluating the Boolean gene-to-reaction mapping in the model
Predicting Knockout Lethality (II) • A gene is predicted essential if it’s knockout yields a significant drop in the maximal possible growth rate • v1 is essential for growth • v6 is not essential for growth
Gene knockout lethality:E. coli in glycerol minimal media • In total, 819 out of the 896 mutants (91%) showed growth behaviors in glycerol minimal medium in agreement with computational predictions • 69% correct prediction out of the experimental essential genes
Gene knockout lethality:Resolving Discrepancies (I) 2. Gene essentiality prediction
Minimization of Metabolic Adjustment (MOMA) (I) • FBA assumes optimality of growth for wild type – evolution drives the growth rate towards optimality • This assumption is not necessarily correct following a gene knockout! • What other objective can capture the • biological essence of these mutations? (hint – the title of this slide)
Minimization of Metabolic Adjustment (MOMA) (II) • Assumption: following the knockout, the mutant remains as close as possible to the wild-type strain • The flux distribution of mutant should also satisfy all constraints as in FBA
w v Minimization of Metabolic Adjustment (MOMA) (III) Formally: w – the wild-type optimal growth vector (obtained via FBA). v – a vector in mutant flux space. Find Vm which minimizes the Euclidian distance to Vwt : • Min (w-v)², - minimize Euclidian distance • s.t • S∙v = 0, - mass balance constraints • vmin v vmax - capacity constraints • vj = 0, jG - knockout constraints Solved using Quadratic Programming (QP)
Regulatory On/Off Minimization (ROOM) (I) • Assumption: The organism adapts by minimizing the set of flux changes (via the regulatory system) • Search for a feasible flux distribution with minimal number of changes from the wild-type byp Wild-type solution A B C E Knockout solution cof cof byp D
Regulatory On/Off Minimization (ROOM) (II) • Integer variables are required to track the ‘number of changes in flux’ from the wild-type • Use Boolean auxiliary variables y to reflect changes in flux between the wild-type and mutant • yi=0 if and only if vi =wi • Formulate a MILP problem to find a pair of v and y with a minimal sum of yi’s. Min yi - minimize changes s.t v – y ( vmax - w) w - distance constraints v – y ( vmin - w) w - distance constraints • S∙v = 0, - mass balance constraints • vj = 0, jG - knockout constraints
Validating ROOM: Alternative pathways • ROOM identifies short alternative pathways to re-route metabolic flux following a gene knockout, in accordance with experimental data
Validating ROOM: Experimental fluxes (I) • Intracellular fluxes measurements in E. coli central carbon metabolism • Obtainedusing NMR spectroscopy in C labelling experiments • Knockouts: pyk, pgi, zwf, and gnd in Glycolysis and Pentose Phosphate pathways • Glucose limited and Ammonia limited medias • FBA wild-type predictions above 90% accuracy 13 Emmerling, M. et al. (2002), Hua, Q. et al. (2003), Jiao, Z et al. (2003) (*) Based on a figure from Jiao, Z., et al.
Validating ROOM: Experimental fluxes (II) • ROOM flux predictions are significantly more accurate than MOMA and FBA in 4 out of 8 experiments • ROOM growth rate predictions are significantly more accurate than MOMA
Constraint-based Modeling:Biotechnological Applications • Design bacteria that produces chemicals of interest Vanillin The major compound in Vanilla Bacteria Objective: Grow Fast Bioengineering Objective: Produce Vanillin Bioengineering Objective Produce Vanillin
OptKnock • Designing microbial organisms for efficient production of metabolites • Finds reactions whose removal increases the production of metabolite of interest
OptKnock: Optimization problem (I) • A nested (bi-level) optimization problem is needed
OptKnock: Optimization problem (I) • A nested (bi-level) optimization problem is needed Reactions to remove Cells have to grow Removed reactions have zero flux The max number of reactions to remove
OptStrain • An integrated framework for redesigning microbial production systems Step 1: Creation of universal reactions DB Step 2: Compute maximal theoretical metabolite production yield Step 3: Identifying the minimal number of required to be added to an organism to achieve the maximal production yield. Step 4: Adding the identified reactions and finding gene deletions that ensure metabolite secretion (OptKnock)
OptStrain: Step 1 • Creation of universal reactions DB • Download set of known reactions from KEGG (Kyoto Encyclopedia of Genes and Genomes) • Validate reaction data consistency – remove unbalanced reaction • Define a universal stoichiometric matrix S.
OptStrain: Step 2 • Determination of maximal theoretical yield of a metabolite of interest • Yield – metabolite production rate per unit of substrate uptake • Use LP to find the maximal yield for different substrates, denoted R
OptStrain: Step 3 • Identification of minimum number of non-native reactions for a host organism • MILP formulation – yi represented whether reaction i should be added to the organism
OptStrain: Step 4 • Incorporating the non-native reactions into the host organism’s stoichiometric model • Eliminate genes such that biomass production is coupled with the production of the metabolite of interest • OptKnock
Case study: Hydrogen production • The highest hydrogen yield (0.126 g/g substrate consumed) is obtained for methanol
Case study: Hydrogen production (I) • Testing E. coli on glucose media • Step 3 reveals that new reactions are needed for E. coli on glucose
Case study: Hydrogen production (II) • C. acetobutylicum - the "Weizmann Organism", after Chaim Weizmann, who in 1916 helped discover how C. acetobutylicum culture could be used to produce acetone, butanol, and ethanol from starch • The knockout of 2 reactions tightly couple biomass production and metabolite hydrogen secretion
Case study: Vanillin production (I) • Vanillin is an important flavor and aroma molecule (found in vanilla pods) • Maximal theoretical production rate: 0.63 (g/g glucose) • E. coli needs 3 new reactions to achieve this vanillin yield • Previous bioengineering experiments have already involved the extraction of these 3 reactions from Neurospora crassa and their addition to E. coli • However, the resulting vanillin production rate was only 0.15
Case study: Vanillin production (II) • OptStrain predicts knockout sets that provide a vanillin yield of 0.57 (g vanillin/g glucose) in E. coli • This is close to the maximal theoretical production rate