Download
1 / 90
960 likes | 1.37k Views
Calculating Revenue costs and profit. Learning Objectives. To learn how to calculate revenue/costs and profit related to a business To learn key terminology and definitions To understand the course programme and assessment structure. To develop presentational skills (2). Course Programme.

E N D
Learning Objectives • To learn how to calculate revenue/costs and profit related to a business • To learn key terminology and definitions • To understand the course programme and assessment structure. • To develop presentational skills • (2)
Course Programme • Financial Planning: • Calculating Revenue Costs and profit • Using Break even Analysis to make decisions • Using Cashflow forecasting • Setting Budgets • Assessing Business Startups • Raising Finance • (2)
Interview • Carry out an interview of your partner and record your answers on the sheet. • Prepare a short presentation on your partner to give to the class. • What have you learnt? • Complete sheet on grades • (30)
Questions • 1.What is the Company and what does it do? • 2.What has been the growth of the company? • 3.List as many job roles as you see • 4.Describe the working environment /culture of the business • 5.What are the five key values of the Company • 6.What is the main aim of the Company
Innocent smoothies • http://www.youtube.com/watch?v=Pizz1fIz8XQ • (25)
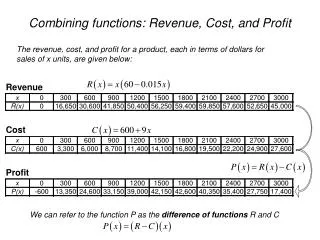
What is Revenue? • Revenue is the value of total sales made by a business within a period –usually a year. • Sales revenue =volume of goods sold x average selling price • (5)
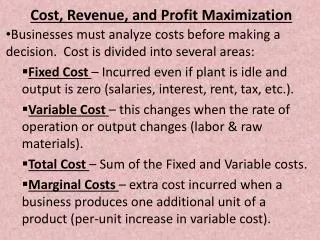
What are Costs? • Costs are the expenses incurred by a firm in producing and selling its products • Fixed –Costs that do not change • Variable-Costs that vary • Directly with the level • Of output. • (5)
Smoothie • Factory • Wages • Utilities • Raw Materials • Transport • Packaging • (5)
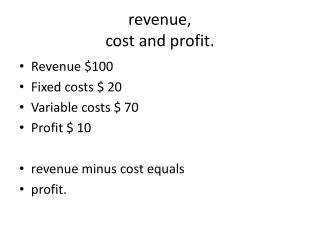
Total Costs& Profits • Total Costs = Fixed + Variable added together • Profit = total revenue – total costs • (5)
Calculating Profits • Gwen and John ‘s pasta restaurant charges £10 for three courses and has an average of 800 customers per week. • The variable costs are £4.00 per customer and fixed costs of £3400 per week. • Calc profit: • Revenue =price x no.of customers • Total costs=fixed costs +total variable costs
Calculating Profit • Profit = total revenue-total costs
Calculating Costs • Revenue= • Total Costs= • Profit = • (10)
Homework • Read Chapter 12
Calculation Practice Questions • 1a -£1800 • 1b-£2200 • 2a-
Learning Objectives • To use prior learning to show understanding of revenue costs and profit in Case Study situations. • To learn key terminology • To develop presentation/communication skills.
Home work Question • Beth Brook Hats employs two hatmakers each at 280 pounds per week.Beth as CEO pays herself 400 pounds per week.The other fixed costs are 300 pounds per week.The variable costs of raw materials are 14 pounds per hat. Hats sell for 50 pounds. • 1.Calculate the profit that Beth is making at her current output level of 60 hats per week,assuming weekly sales match output.
Case Study A/B • You will work in a group of three to solve the Case Study questions and put the answers into a powerpoint presentation to deliver to the rest of the class. • (60) • You must print a copy for your folder
Homework • Discuss whether a new ethnic restaurant trading in a very competitive market should aim to maximise its revenue rather than its profits during its first year of trading.
Introduction • This essay is about whether ……… • Explain what the essay is about-define any key terms.
Paragraph 1 • In my opinion it is important that in any business the ceo/manager has a good grasp of the financial situation of the company-eg • Costs revenue profits -explain why
Paragraph 2 • It could be argued that because it is a new company that needs to establish itself then maximising sales revenue is the key not profits –Why? • Encouraging more people to buy your product
Paragraph 3 • Therefore it would be wise to push sales by keeping the price as low as possible without making a loss but not being so concerned with a high profit at this stage. • Why
Para 4 • On the other it might be an opportunity to deliver a more exclusive product by giving a higher price that creates a bigger profit margin. • Why might this be a good business strategy?
Conclusion • However I believe that by …………. • Explain what you think is the right financial strategy
Learning Objectives • To learn how to construct and write an essay using a basic framework. • To reinforce learning on fixed and variable costs using graphs • To learn the concept of break even analysis
Homework • Discuss whether a new ethnic restaurant trading in a very competitive market should aim to maximise its revenue rather than its profits during its first year of trading. • (30)
Break Even Analysis • Break-even analysis compares a firm’s revenue with its fixed and variable costs to identify the minimum level of sales needed to cover costs.
Break even Point • Selling price of the product • Fixed costs • Variable costs per unit
Break even point formula • Break even output=Fixed Costs/(selling price per unit-variable cost per unit)
Guided Tour Company • Sue Pittman is planning to offer an open top bus ride in london during the summer months to take tourists on sightseeing tours of the Captial.4 trips per day and the cost of each trip will be £400 inc. fuel wage costs etc.The trip will include a snack drink and guide book for each passenger(estimate £10 for each passenger ). Maximum 40 passengers per trip.Sue intends to charge £30 per passenger.
Break even output calculationHow many passengers are needed ? • = £400(FC) £30-10(selling price –variable cost per unit) =£400 £20 =20 passengers (15)
Berry & Hall Ltd • Berry & Hall Ltd are manufacturers of sweets.The company is planning to launch a new line called Aromatics-a distinctive sweet with a very strong fragrance.The Company intends to sell these sweets for £1 per kilogram.The variable cost is £0.60 p a kilogram and the fixed costs are £50000 .The company’s maximum output will be 250000 kg per year.
Hotel • Forecast: • Max number of customers per month =800 • Monthly Fixed costs =£10,000 • Revenue per customer £110 • Variable costs per customer = £90 • Construct break even chart for the business
HW • 1a or worksheet 11
Learning Objectives • To learn how to draw and use Break even Charts. • To learn how to interpret Break even charts • To identify strengths and weaknesses of using such a tool in business. • To learn key terminology
Using Break Even Charts • It can show amount of profit or loss at any given output. • Breakeven point shows any output lower than 150000kg is making a loss. • What is the loss if the company’s output drops to 90,000 units per year. • (3s) • Whiteboard
Using Break even Charts • What is the profit if the output goes up to 150,000kg
Margin of Safety • This is the amount by which demand can fall before the company starts to make a loss. • What is the margin of safety on sales of 175000kg
Business is not static and may change • What happens to the Break even point if fixed costs increase by £15000 per year.Draw new lines (dotted onto your graph). • What happens to the breakeven point if the revenue line drops to £200,000