Download
1 / 69
690 likes | 861 Views
How many object categories are there?. ~10,000 to 30,000. Biederman 1987. So what does object recognition involve?. Verification: is that a lamp?. Detection: are there people?. Identification: is that Potala Palace?. Object categorization. mountain. tree. building. banner. street lamp.

E N D
How many object categories are there? ~10,000 to 30,000 Biederman 1987
Object categorization mountain tree building banner street lamp vendor people
Scene and context categorization • outdoor • city • …
meters Ped Ped Car meters Assisted driving Pedestrian and car detection Lane detection • Collision warning systems with adaptive cruise control, • Lane departure warning systems, • Rear object detection systems,
Improving online search Query: STREET Organizing photo collections
Challenges 1: view point variation Michelangelo 1475-1564
Challenges 2: illumination slide credit: S. Ullman
Challenges 3: occlusion Magritte, 1957
Challenges 5: deformation Xu, Beihong 1943
Challenges 6: background clutter Klimt, 1913
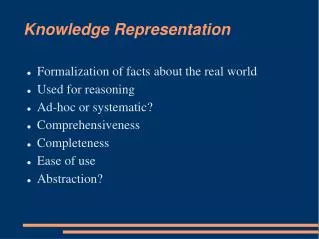
Issues • RepresentationHow to represent image, memory? • Low or high level? Concrete or abstract? • Appearance, shape, or both? • Local or global? • Invariance, dimensionality reduction • Memory contactWhen do you make it? • Bottom up? Top down? • Difficulty of computation
Issues • Learning • Recognition • Discriminative or generative? • Specific object or object category? • One object or many? • Categorization or detection? • Scaling up?
Local, low level Representation The image itself
Representation • Part-based
Representation • Part-based
The correspondence problem • Model with P parts • Image with N possible assignments for each part • Consider mapping to be 1-1 • NP combinations!!!
Deformable Template Matching Berg, Berg and Malik CVPR 2005 Query Template • Formulate problem as Integer Quadratic Programming • O(NP) in general • Use approximations that allow P=50 and N=2550 in <2 secs
Global representation
Learning • Unclear how to model categories, so we learn what distinguishes them rather than manually specify the difference -- hence current interest in machine learning
Recognition • Scale / orientation range to search over • Speed • Context
Geons • Biederman, description of geons. Are they still view invariant when describing a geon? • 3D shape’s occluding contour depends on viewpoint. May be straight from one view, curved from another. • Metric properties not truly invariant. • Maybe more like quasi-invariants.
Geons for Recognition • Analogy to speech. • 36 different geons. • Different relations between them. • Millions of ways of putting a few geons together.
Chamfer Matching For every edge point in the transformed object, compute the distance to the nearest image edge point. Sum distances.
convert x into v1, v2 coordinates What does the v2 coordinate measure? • distance to line • use it for classification—near 0 for orange pts What does the v1 coordinate measure? • position along line • use it to specify which orange point it is Linear subspaces • Classification can be expensive • Must either search (e.g., nearest neighbors) or store large PDF’s • Suppose the data points are arranged as above • Idea—fit a line, classifier measures distance to line
Dimensionality reduction • How to find v1 and v2 ? • - work out on board • Dimensionality reduction • We can represent the orange points with only their v1 coordinates • since v2 coordinates are all essentially 0 • This makes it much cheaper to store and compare points • A bigger deal for higher dimensional problems
Linear subspaces Consider the variation along direction v among all of the orange points: What unit vector v minimizes var? What unit vector v maximizes var? Solution: v1 is eigenvector of A with largest eigenvalue v2 is eigenvector of A with smallest eigenvalue
Principle component analysis • Suppose each data point is N-dimensional • Same procedure applies: • The eigenvectors of A define a new coordinate system • eigenvector with largest eigenvalue captures the most variation among training vectors x • eigenvector with smallest eigenvalue has least variation • We can compress the data by only using the top few eigenvectors • corresponds to choosing a “linear subspace” • represent points on a line, plane, or “hyper-plane” • these eigenvectors are known as the principle components
= + The space of faces • An image is a point in a high dimensional space • An N x M image is a point in RNM • We can define vectors in this space as we did in the 2D case
Dimensionality reduction • The set of faces is a “subspace” of the set of images • Suppose it is K dimensional • We can find the best subspace using PCA • This is like fitting a “hyper-plane” to the set of faces • spanned by vectors v1, v2, ..., vK • any face
Eigenfaces • PCA extracts the eigenvectors of A • Gives a set of vectors v1, v2, v3, ... • Each one of these vectors is a direction in face space • what do these look like?
Projecting onto the eigenfaces • The eigenfaces v1, ..., vK span the space of faces • A face is converted to eigenface coordinates by
Recognition with eigenfaces • Algorithm • Process the image database (set of images with labels) • Run PCA—compute eigenfaces • Calculate the K coefficients for each image • Given a new image (to be recognized) x, calculate K coefficients • Detect if x is a face • If it is a face, who is it? • Find closest labeled face in database • nearest-neighbor in K-dimensional space
i = K NM Choosing the dimension K eigenvalues • How many eigenfaces to use? • Look at the decay of the eigenvalues • the eigenvalue tells you the amount of variance “in the direction” of that eigenface • ignore eigenfaces with low variance
One simple method: skin detection • Skin pixels have a distinctive range of colors • Corresponds to region(s) in RGB color space • for visualization, only R and G components are shown above skin • Skin classifier • A pixel X = (R,G,B) is skin if it is in the skin region • But how to find this region?
Skin classifier • Given X = (R,G,B): how to determine if it is skin or not? Skin detection • Learn the skin region from examples • Manually label pixels in one or more “training images” as skin or not skin • Plot the training data in RGB space • skin pixels shown in orange, non-skin pixels shown in blue • some skin pixels may be outside the region, non-skin pixels inside. Why?
Skin classification techniques • Skin classifier • Given X = (R,G,B): how to determine if it is skin or not? • Nearest neighbor • find labeled pixel closest to X • choose the label for that pixel • Data modeling • fit a model (curve, surface, or volume) to each class • Probabilistic data modeling • fit a probability model to each class
Choose interpretation of highest probability • set X to be a skin pixel if and only if Where do we get and ? Probabilistic skin classification • Now we can model uncertainty • Each pixel has a probability of being skin or not skin • Skin classifier • Given X = (R,G,B): how to determine if it is skin or not?
Approach: fit parametric PDF functions • common choice is rotated Gaussian • center • covariance • orientation, size defined by eigenvecs, eigenvals Learning conditional PDF’s • We can calculate P(R | skin) from a set of training images • It is simply a histogram over the pixels in the training images • each bin Ri contains the proportion of skin pixels with color Ri This doesn’t work as well in higher-dimensional spaces. Why not?