Download
1 / 49
490 likes | 653 Views
Performance Evaluation of IP Telephony over University Network. By M. Kousa, M Sait, A. Shafi, A. Khan King Fahd Univ. of Petroleum & Minerals (KFUPM) Dhahran, Saudi Arabia. A project funded by University Fast Track. Presentation Outlines. Definition of VoIP.

E N D
Performance Evaluation of IP Telephony over University Network By M. Kousa, M Sait, A. Shafi, A. Khan King Fahd Univ. of Petroleum & Minerals (KFUPM) Dhahran, Saudi Arabia. A project funded by University Fast Track
Presentation Outlines • Definition of VoIP. • Performance and Quality Indicators. • University Networks • Assessment Designs. • LAN Assessment Results • Wi-FI Assessment Results. • ADSL Assessment Results • Conclusions. Evaluation of VoIP over University Networks
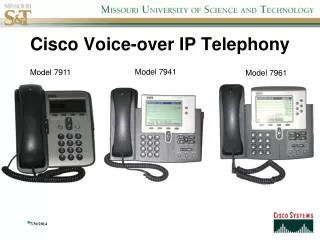
What is IPT • Special telephone sets connected directly to a network port (RJ45) • Carrying voice traffic over the data network. • Circuit-Switched versus Packet-switched • Enabler: VoIP protocols. Evaluation of VoIP over University Networks
Performance and Quality Indicators • Delay (or Latency): Time takes a packet to make its way through a network end-to-end. • Packet Loss: Due to errors in Header of Buffer overflow. • Jitter: The measure of the variation of packet arrival time. • Mean Opinion Square (MOS): The most well-known measure of voice quality. Evaluation of VoIP over University Networks
Coding and Compression Algorithms • The process of converting Analog voice signals to digital data signals is done with a coder-decoder (CODEC). • codec selection depends on bandwidth and quality. Evaluation of VoIP over University Networks
University Networks Voice over IP (VoIP) assessment is performed for all four kinds of university networks. Evaluation of VoIP over University Networks
University Academic Buildings considered for LAN Assessment Test Design List of University Academic Buildings, considered for VoIP Test Evaluation of VoIP over University Networks
University LAN Assessment Test Design LAN Assessment Physical Connectivity Diagram Evaluation of VoIP over University Networks
University LAN Assessment Test Design LAN Assessment Logical Connectivity Diagram Evaluation of VoIP over University Networks
University LAN Assessment Test Design • Worst-case scenario: half of the telephone users are busy on calls. • Calls originating from any building are distributed to all other buildings according to their user intensity. • Figure shows concurrent number of calls between any two buildings. • All calls are assumed to last for 3 minutes, while the inter-call delay for the calls on the same link was set to 5 minutes. Evaluation of VoIP over University Networks
LAN Assessment Results Evaluation of VoIP over University Networks
LAN Assessment ResultsMOS Results Evaluation of VoIP over University Networks
University LAN Utilization Building 21 LAN Utilization for a Year 2007-08 Building 14 LAN Utilization for a Year 2007-08 Evaluation of VoIP over University Networks
University Wireless LAN (WiFi) • IEEE 802.11g standard which supports up to 54 Mbps. • The wireless access points are back connected to the layer-2 switches • Layer-2 switches are connected to the building layer-3 switch. • Layer-3 switch forwards the data over the fiber-optic link to the university core network. Evaluation of VoIP over University Networks
WiFi Assessment Tests Design, Physical Connectivity (Bldg 59) • Room 0032 (very good signal) • Room 0072 – PC1 (good signal) • Room 0072 – PC2 (good signal, Linked with same AP as of PC1) • Room 0081 (far from AP, poor signal) • Room 1079 (far from AP, poor signal) • Room 2078 (Excellent signal) Evaluation of VoIP over University Networks
WiFi Assessment Tests Design, Logical Connectivity • Three levels of traffic intensity • Low: one call is initiated between any pair • Medium: 2 simultaneous calls are initiated between any pair • High: 4 simultaneous calls are initiated between any pair. Evaluation of VoIP over University Networks
WiFi Assessment Results G711 – 1 Call • The performance seems to be pretty good for more than 99% of the calls. • The average delay was always below 45 ms, which is quite acceptable. • The lost data was negligible (less than 0.03%). Evaluation of VoIP over University Networks
WiFi Assessment Results G711 – 2 Calls: Call Quality (MOS) Evaluation of VoIP over University Networks
WiFi Assessment Results G711 – 2 Calls: Factors Affecting MOS The percentage effect of each of the other three factors; delay, jitter, lost data,is shown in figure. The source of poor quality is mainly due to delay (51%) and lost data (41%). The effect of jitter is much smaller (8%). Evaluation of VoIP over University Networks
WiFi: G711 – 2 Calls: Call Quality by Call Group Room 0081 and its AP is the source of trouble. All communications between 0081 and other nodes are poor, and they are the only poor links. Evaluation of VoIP over University Networks
WiFi: G711 – 2 Calls: Delay The delay varies between 300 and 310 ms, which is on the high side. Room 0081 and its AP is the source of trouble. The delay on those pairs where this link is involved exceeds 800 ms, while the delay on other groups are very low (45 m sec). Evaluation of VoIP over University Networks
WiFi: G711 – 2 Calls: Lost Data The lost data varies between 6.6% and 7.7%. In both plots, the high values are noticed in the hours 8:00 – 10:00 AM, indicating a slightly more traffic activity of the WiFi network at this period. On those poor groups the lost data exceeds 20% Evaluation of VoIP over University Networks
WiFi: G711 – 2 Calls: Sample Call Quality Zooming in to the call level, the figure shows three random calls for a good group, while second figure shows three random calls for a poor group. For the first group the quality is maintained well throughout the call duration, while the quality is poor throughout the duration of second call, with short intervals when the communication is lost. Evaluation of VoIP over University Networks
WiFi Assessment Results G711 – 4 Calls: Call Quality (MOS) Figure shows the overall statistics of call quality. The Figure shows that the call quality is poor most of the time (75%). The quality is acceptable for 14% of the time, and good for 10% of the time. Evaluation of VoIP over University Networks
WiFi Assessment Results G711 – 4 Calls: Factors Affecting MOS The percentage effect of the three performance factors is shown in Figure below. Here we can clearly see that the source of poor quality is lost data (52 %) and delay (44%). The effect of jitter is marginal (4%) therefore no further analysis of jitter is carried out. Evaluation of VoIP over University Networks
WiFi: G711 – 4 Calls: Call Quality by Call Group Evaluation of VoIP over University Networks
WiFi: G711 – 4 Calls: Call Quality by Hour The Figure shows the effect of the data traffic on the quality of IPT traffic (MOS ~ 2.7 in light traffic hours 11 pm – 7 am) (MOS ~ 2.1 in Busy Hour (BH) 8am – 9 pm) Evaluation of VoIP over University Networks
WiFi: G711 – 4 Calls: Delay by Hour Figure shows that the delay has been always excessive (average delay over 600 ms and in busy hours it even approaches 740 ms). Evaluation of VoIP over University Networks
WiFi: G711 – 4 Calls: Lost Data of Best and Worst Call by Hour The figure shows the lost data evaluation, the average percentage of lost data has been above 16%, and exceeding 28% during Busy hours. Evaluation of VoIP over University Networks
WiFi: G711 – 4 Calls: Sample Call Quality Finally, we show through-call evaluation of Call Quality and corresponding Lost Data of some selected calls on the best link. Two such calls are depicted in figures. It is interesting to show that while a high MOS is maintained throughout the call duration there are intermittent periods when call quality drops to a poor level. These are the periods when the link suffers from large packet loss. Evaluation of VoIP over University Networks
WiFi Assessment Results G723 – 1 Call: Call Quality (MOS) The performance is always acceptable. It should be noted that “acceptable” is the best quality that can be obtained for G723. Evaluation of VoIP over University Networks
WiFi Assessment Results G723 – 1 Call: Factors Affecting MOS Therefore, that “acceptability” of the quality of the IPT call is mainly due to codec. The average delay is in the range of 130 ms. This is higher that the average delay for the G711 codec under same traffic load, due to the extra processing time for compression. Evaluation of VoIP over University Networks
WiFi Assessment Results G723 – 4 Calls: Call Quality (MOS) By increasing the number of calls to 4 between each pair, the quality gets severely affected. Figure shows that only 28% of the calls are now acceptable. Evaluation of VoIP over University Networks
WiFi: G723 – 4 Calls: Call Quality by Call Group The pattern of variation of performance between groups is very much similar to the 2-call case of G-711. Namely, the groups are classified in two sets; always acceptable (MOS=3.6), and always poor (MOS=1.4). Evaluation of VoIP over University Networks
WiFi: G723 – 4 Calls: Call Quality of Best and Worst Group by Hour Since data rate of G723 is low, there does not seem to be a Busy Hour effect on the MOS for either set. Evaluation of VoIP over University Networks
WiFi: G723 – 4 Calls: Call Inside Details The call quality within the duration of the call is maintained almost constant, for "acceptable groups" as well as poor groups. Evaluation of VoIP over University Networks
University ADSL Network • ADSL service provided on campus is at G-Lite rate (1.5 Mbps downlink and 0.5 Mbps uplink). • The ADSL system of university is of modular nature. There are total of 10 DSLAMs and each DSLAM has a capacity of approximately 100 ADSL lines. Each DSLAM uplink supports 100 Mbps and is connected to the layer-2 switch. Evaluation of VoIP over University Networks
University ADSL Assessment Design ADSL Assessment Test Logical Connectivity ADSL Assessment Test Physical Connectivity Evaluation of VoIP over University Networks
ADSL Assessment Results ADSL Assessment Parameters used for VoIP Test • For G711 codec: 100% good result, Delay < 62 ms, Jitter and Lost Data almost negligible. • For G723 codec: Similar results, slightly lower MOS and higher delay. Evaluation of VoIP over University Networks
ADSL Assessment ResultsCall Quality (MOS) for G711 Evaluation of VoIP over University Networks
ADSL Assessment ResultsDelay and Lost Data for G711 Evaluation of VoIP over University Networks
ADSL Assessment ResultsCall Quality (MOS) for G723 Evaluation of VoIP over University Networks
ADSL Assessment ResultsCall Quality (MOS) by Hour and by Group, for G723 Evaluation of VoIP over University Networks
ADSL Assessment ResultsDelay and Lost Data for G723 Evaluation of VoIP over University Networks
Conclusions: LAN • The performance of IPT over LAN was perfect, even when an unrealistically exaggerated traffic was assumed (50% of users are busy on call). • The delay was at its minimum value (~ 40ms for G711 and ~130 ms for G723), and lost data and jitter loss was close to zero. • The MOS parameter was always approaching the maximum possible for each of the two codecs i.e. 4.38 for G711 and 3.65 for G723. • No noticeable variation on the call quality was observed during the span of 7 days nor during the span of the whole day. • No difference in performance may be attributed to the specific locations of the nodes or Busy Hour of data traffic. Evaluation of VoIP over University Networks
Conclusions on ADSL • Although the ADSL link is nowhere close to the capacity of LAN, it is a dedicated link per house. • For G711 codec call quality remained at maximum possible throughout the duration of test. • The delay was found to be well within the limits, and jitter and lost data were almost negligible. • All links behaved equally well without any effects of local loop and of intra-DSALM or inter-DSLAM calls. • The results for the G 723 codec were similarly perfect, taking into considerations the slightly lower MOS value and slightly high delay due to the use of this compressed codec. • The DSLAM network can safely support maximum number of realistically expected calls from any typical house. Evaluation of VoIP over University Networks
Conclusion • Lowe traffic: • The performance seems to be pretty good for more than 99% of the calls. • The average delay was always below 45 ms • Lost data was negligible (less than 0.03%). • Moreover, all links performed equally well. • Medium Traffic: • 33% of the calls became poor. • High variation in call quality between different pairs of nodes, some being consistently “good” and others being consistently “poor”. • By examining the poor links, we found one node common to all. • The channel between that node and the nearest Access Point is poor, therefore affecting all the communications where this node is involved. Evaluation of VoIP over University Networks
Conclusion • High Traffic • call quality became poor most of the time (75%). • we started to notice the effect of Busy Hours of data traffic on IPT quality. • The MOS of calls between 9 pm-8 am were found to be 30% above that for calls between 8 am – 9 pm. • G723 results was similar in pattern to those of G711 with two differences: • The best quality for this codec is “acceptable” rather than “good”. • It does not get much affected with data traffic intensity. Evaluation of VoIP over University Networks
Thank You Evaluation of VoIP over University Networks