Download
1 / 19
190 likes | 254 Views
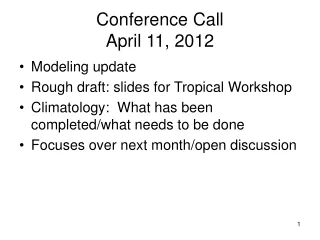
Conference Call March 14, 2012. Decay over land Update on modeling work Training material for WFOs Open discussion. Decay over Land. Goals: Show how the wind speeds of “typical” landfalling tropical cyclones decay once over land Show how wind speeds compare to NHC guidance.

E N D
Conference CallMarch 14, 2012 • Decay over land • Update on modeling work • Training material for WFOs • Open discussion
Decay over Land Goals: • Show how the wind speeds of “typical” landfalling tropical cyclones decay once over land • Show how wind speeds compare to NHC guidance
Decay over Land Data set to use: • ASOS station observations frequently go missing (see JB’s blog posting) • HWIND analyses often not available once storm is over land • RUC analyses chosen • Available from NCDC since 2002 (data not online for 2006-2007—looking into this now)
Decay over Land • Only storms that actually made landfall used in study • Only times the storm is over land used in analysis • Storm list: • Gabrielle (2007) -Irene (2011) • Kyle (2002) -Gaston (2004) • Isabel (2003) -Hanna (2008) • Charley (2004) -Ernesto (2006) • TD7 (2003)
Decay over Land—Strong StormsIsabel (2003) & Irene (2011) Isabel (2003) Irene (2011)
Decay over Land—Weaker Storms Kyle (2002) Gaston (2004)
Decay over Land • Strong storms show sharp reduction in wind over first 6-24 hours once over land; little change afterwards • Timing of sharpest decrease in winds depends on angle with respect to coastline • Weaker storms show little reduction once over land • Sometimes, outer radii actually have slightly higher winds than closer to storm
Land Decay Discussion • Land decay and climatology: other data sets to you besides RUC? NARR? CFSR? • Land decay and climatology: radii to use? • Reduction vs. max. wind forecast for various radii: calculate ratio of RUC analyzed winds at various radii and compare to forecast at each time?
Landfall Verification: Run 4 SIMULATED LANDFALL TIME: 08/27/1500 UTC LANDFALL CENTRAL SLP: 961 hPa BEST TRACK LANDFALL TIME: 08/27/1200 UTC LANDFALL CENTRAL SLP: 952 hPa
Run #7 • RTG SST data updated every 6 hours • Initialized 8/27/00 UTC (12 hours prior to landfall) • 9 km / 3 km nested run
Best Track vs. Run #7 Track Irene 5 (SST updated, 8/25/12z initialization) Irene 7 (SST updated, 8/27/00z initialization)
HWIND ANALYSIS, 8/27/1330 UTC ANALYZED MAX WIND: 80 KTS OBSERVED MAX WIND: 75 KTS Model Run 7, 8/27/1300 UTC MODELED MAX WIND: 70.3 KTS
Landfall Verification: Run 7 SIMULATED LANDFALL TIME: 08/27/1300 UTC LANDFALL CENTRAL SLP: 959 hPa BEST TRACK LANDFALL TIME: 08/27/1200 UTC LANDFALL CENTRAL SLP: 952 hPa
Current/Future Modeling Work • Zhu et. Al (2008): WRF-LES simulation for Ivan (2004) • Provides guidance for initial WRF-LES simulation/namelist.input parameters • 5 domains, two-way nested: 8.1 km, 2.7 km, .9 km, .3 km, and .1 km grid spacing • Compare buoy/ASOS data to innermost domain
Training Slides Outline (Gail Hartfield) • Slide 1: Overview of project purpose and plans • Slide 2: Basics of study: data/models used (could be combined with Slide 1) • Slide 3: Results of observed wind analyses (Irene) • Slide 4: NDFD verification summary (Irene)
Training Slides Outline (Gail Hartfield) • Slide 5: Summary of modeling results • Slide 6: Potential TCWindTool improvements & Mike Brennan notes on TCM limitations • Slide 7: Guidance for WFOs on speed reduction and gusts in TCs • Slide 8: Future plans: Wind reduction & gust factors based on distance from center, topography, distance inland, etc.
Open Discussion • Training slides discussion • Other topics? • Next call date: Wednesday, April 11th at 11 a.m.