Download
1 / 19
220 likes | 452 Views
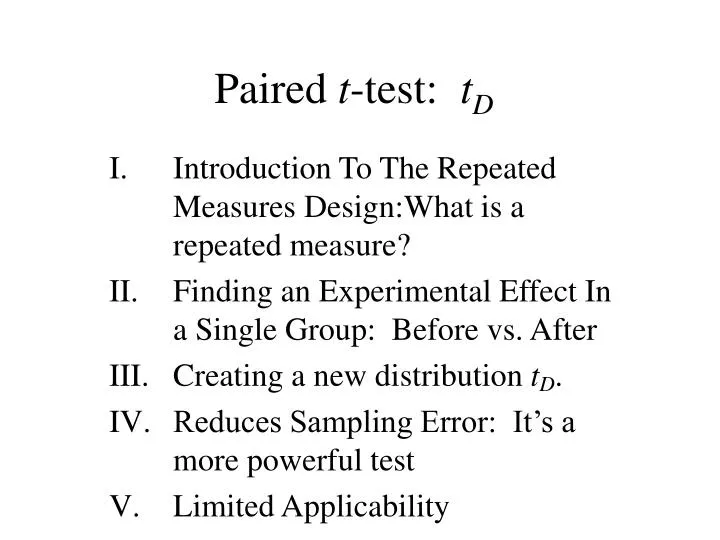
Paired t -test: t D. Introduction To The Repeated Measures Design:What is a repeated measure? Finding an Experimental Effect In a Single Group: Before vs. After Creating a new distribution t D . Reduces Sampling Error: It’s a more powerful test Limited Applicability. Before-After.

E N D
Paired t-test: tD Introduction To The Repeated Measures Design:What is a repeated measure? Finding an Experimental Effect In a Single Group: Before vs. After Creating a new distribution tD. Reduces Sampling Error: It’s a more powerful test Limited Applicability
Before-After Pre-Measure Post-Measure Manipulation Anthony Greene
It doesn’t have to be “Before-After” Anthony Greene
Matched Subject Design For a given study the two groups of subjects could be closely matched • Age • IQ • Blood Pressure • Income • Education Level Anthony Greene
The Basic Idea • Standard t-test Anthony Greene
The Basic Idea • Standard t-test Anthony Greene
The Basic Idea • Standard t-test • Is 13 different than 17? Or 13-17 different than 0? Anthony Greene
The Basic Idea • Repeated Measures t-test Anthony Greene
The Basic Idea • Repeated Measures t-test • Create A New Variable, D Anthony Greene
The Basic Idea • Repeated Measures t-test • Is 4 different than 0? Anthony Greene
The Basic Idea The fundamental advantage? • The error term in the within subjects design is smaller • In the simplified example, the standard error terms would be higher in the two sample version versus the difference test (in this case the sMDis zero) • The advantage is that individual differences (2, 13, 24, and 5, 16, 27) are not part of the error in tD Anthony Greene
The Basic Idea Are there limitations? • The repeated measure design (before – after) must be used cautiously used in many experimental designs • Memory Subjects learn • Medicine and Clinical Psych Substantial time passes • Social Psych Minor deceptions • Loss of half the degrees freedom Anthony Greene
Distribution of the Paired t-Statistic Suppose x is a variable on each of two populations whose members can be paired. Further suppose that the paired-difference variable D is normally distributed. Then, for paired samples of size n, the variable has the t-distribution with df = n – 1. The normal null hypothesis is that μD = 0 Anthony Greene
The paired t-test for two population means (Slide 1 of 3) Step 1 The null hypothesis is H0: D = 0; the alternative hypothesis is one of the following: Ha: D 0Ha: D< 0Ha: D> 0 (Two Tailed) (Left Tailed) (Right Tailed) Step 2 Decide on the significance level, Step 3 The critical values are ±t/2 -t+t (Two Tailed) (Left Tailed) (Right Tailed) with df = n - 1. Anthony Greene
The paired t-test for two population means (Slide 2 of 3) Anthony Greene
The paired t-test for two population means(Slide 3 of 3) Step 4 Compute the value of the test statistic Step 5 If the value of the test statistic falls in the rejection region, reject H0, otherwise do not reject H0. Anthony Greene
The number of doses of medication needed for asthma attacks before and after relaxation training. Anthony Greene
x1 x2 A Direct Comparison Anthony Greene
x1 x2 A Direct Comparison Anthony Greene