Download
1 / 23
230 likes | 495 Views
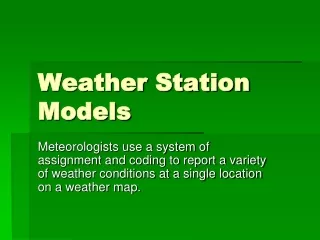
Learn to interpret station model data including temperature, cloud cover, wind direction, visibility, and barometric pressure adjustments to predict weather conditions accurately.

E N D
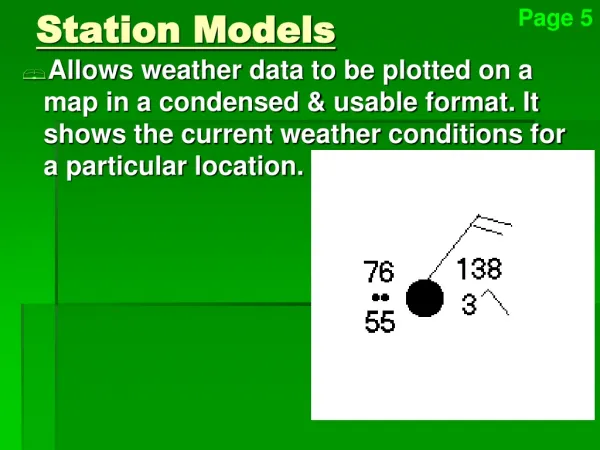
Station Models • and in the immortal words of Bob Wood, my high school Latin teacher… Yajustgottaknow’um
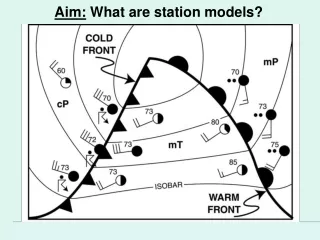
page 13 of the ESRT Temperature on the station model is displayed in degrees F
Cloud Cover Temperature Current Weather 76 138 Wind Direction & Speed . 4 Visibility 3\ 74 Dewpoint Barometric Trend Barometric Pressure
What did they do? 280 Removed a decimal and kept the 1st three numbers. 084
Barometric Pressure . 138 138 55 Add a decimal between the last two digits 13.8 Add a 9 or 10 in front to fit on the scale (ranges from 950.0 to 1050.0) 1013.8 mb
Add a decimal look to where it fits. 1028.1 1020.6 968.0
°F °F °F °F
°F °F °F °F
15) Which weather-station model shows an air pressure of 993.4 millibars?
Which weather-station model shows an air pressure of 993.4 millibars? Drop the decimal and keep the last three numbers.
How far can you see at station model D? 9 miles How far can you see at station model B? 2 miles
Station Models • Create a station model with the following data: • Temperature = 65ºF • Clear skies (no clouds) • Dew point = 55ºF • Wind is south at 15 knots • Barometric pressure = 984.3 mb • Barometric trend is a steady 2.3 rise. When you are doing wind direction draw in a compass if it helps. Just erase it at the end. N W E S
This is what it should look like: 65 843 +23/ 55
Which has the greatest probability of precipitation? First look at cloud coverage Then look for the station model that has the closest air temperature and dewpoint temperature
76 138 . 4 3\ 74