Download
1 / 4
40 likes | 51 Views
Analyze business unit contracts to identify least number meeting revenue criteria, optimizing corporate oversight and performance. Monitor program risks like funding timeliness, financial reporting issues, and staff capacity. Utilize SV and CV metrics to track progress and implement effective Get Well Plans.

E N D
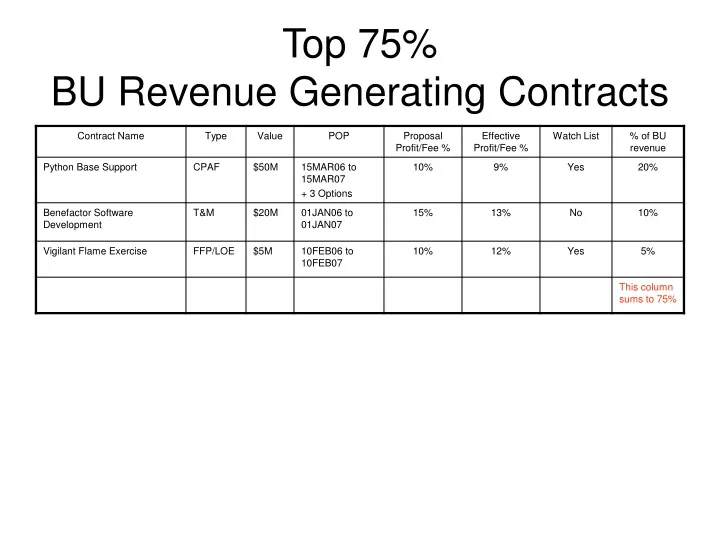
Top 75% BU Revenue Generating Contracts Directions: • Calculate % of revenue for all contracts in BU. • Present the fewest number of contracts here, whose combined % of BU revenue equals 75%. Watch List: • Identify contracts that meet the following proposal criteria (and were therefore subject to corporate oversight according to the authority matrix CO 201 Attach 1): • FP > $5M • CPFF, CPAF, T&M, FFP/LOE > $50M • Bid below profit/fee thresholds • CPAF 10% • CPFF 8% • FFP/LOE 12% • FFP/Comp 15% • T&M 9%
Top 75% Performance • These are carried over from previous chart • Up/Down arrow indicates direction of trend
Program Risk: Staffing issues (G/Y/R) Cure notice (R) Show cause (R) Negative CPAR (Y/R) OCI issues (G/Y/R) Funding Risk 30 day notices for 75% expenditure Financial reporting (deliverables) Funding timeliness issues Incremental/full funding issues LOE/Burn Where you are in your funding expenditures compared to your negotiated plan and/or contract value Green: +/- 0-5% Yellow: +/- 6-10% Red: > 10% SV($) – Schedule Variance SV($) = BCWP - BCWS or EV – PV Measured in $’s > 0 means ahead of schedule (G) = 0 means on schedule (G) < 0 means behind schedule (Y/R) CV($) – Cost Variance CV($) = BCWP - ACWP or EV - AC > 0 means under budget (G) = 0 means on budget (G) < 0 means over budget (Y/R) Get Well Plan How you are addressing your performance issues Top 75% Performance