Download
1 / 16
160 likes | 239 Views
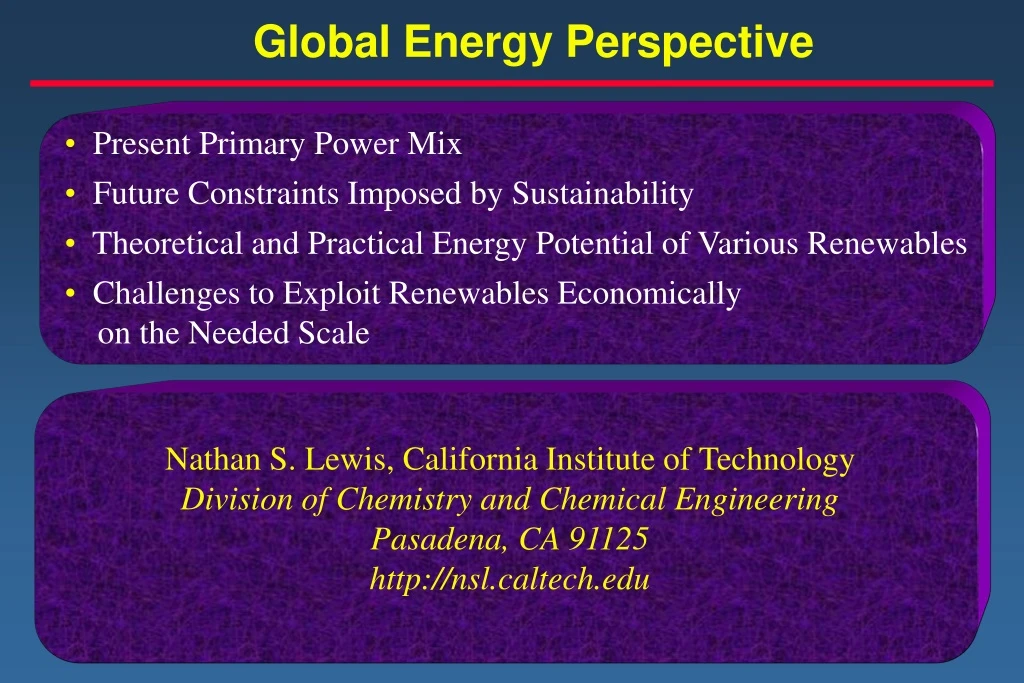
Discover the present and future primary power mix, theoretical and practical energy potential of renewables, challenges in exploiting renewables economically, and constraints impoesd by sustainability.

E N D
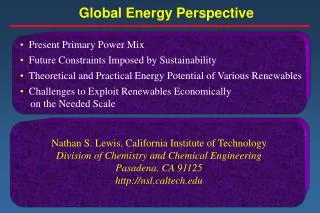
Global Energy Perspective • Present Primary Power Mix • Future Constraints Imposed by Sustainability • Theoretical and Practical Energy Potential of Various Renewables • Challenges to Exploit Renewables Economically on the Needed Scale Nathan S. Lewis, California Institute of Technology Division of Chemistry and Chemical Engineering Pasadena, CA 91125 http://nsl.caltech.edu
Mean Global Energy Consumption, 1998 Gas Hydro Renew Total: 12.8 TW U.S.: 3.3 TW (99 Quads)
US Energy Flow -1999Net Primary Resource Consumption 102 Exajoules
3E-1 Energy From Renewables, 1998 1E-1 1E-2 2E-3 TW 1.6E-3 1E-4 7E-5 5E-5 Elec Heat EtOH Wind Sol PV SolTh LowT Sol Hydro Geoth Marine Biomass
Today: Production Cost of Electricity (in the U.S. in 2002) 25-50 ¢ Cost, ¢/kW-hr 6-7 ¢ 5-7 ¢ 6-8 ¢ 2.3-5.0 ¢ 1-4 ¢
Energy Costs $0.05/kW-hr Europe Brazil www.undp.org/seed/eap/activities/wea
Energy Reserves and Resources Rsv=Reserves Res=Resources Reserves/(1998 Consumption/yr) Resource Base/(1998 Consumption/yr) Oil 40-78 51-151 Gas 68-176 207-590 Coal 224 2160
Conclusions • Abundant, Inexpensive Resource Base of Fossil Fuels • Renewables will not play a large role in primary power generation • unless/until: • technological/cost breakthroughs are achieved, or • unpriced externalities are introduced (e.g., environmentally • -driven carbon taxes)
Energy and Sustainability • “It’s hard to make predictions, especially about the future” • M. I. Hoffert et. al., Nature, 1998, 395, 881, “Energy Implications of Future Atmospheric Stabilization of CO2 Content • adapted from IPCC 92 Report: Leggett, J. et. al. in • Climate Change, The Supplementary Report to the • Scientific IPCC Assessment, 69-95, Cambridge Univ. • Press, 1992
Population Growth to 10 - 11 Billion People in 2050 Per Capita GDP Growth at 1.6% yr-1 Energy consumption per Unit of GDP declines at 1.0% yr -1
Total Primary Power vs Year 1990: 12 TW 2050: 28 TW
Carbon Intensity of Energy Mix M. I. Hoffert et. al., Nature, 1998, 395, 881
CO2 Emissions Data from Vostok Ice Core
Hoffert et al.’s Conclusions • “These results underscore the pitfalls of “wait and see”.” • Without policy incentives to overcome socioeconomic inertia, development of needed technologies will likely not occur soon enough to allow capitalization on a 10-30 TW scale by 2050 • “Researching, developing, and commercializing carbon-free primary power technologies capable of 10-30 TW by the mid-21st century could require efforts, perhaps international, pursued with the urgency of the Manhattan Project or the Apollo Space Program.”
Lewis’ Conclusions • If we need such large amounts of carbon-free power, then: • current pricing is not the driver for year 2050 primary energy supply • Hence, • Examine energy potential of various forms of renewable energy • Examine technologies and costs of various renewables • Examine impact on secondary power infrastructure and energy utilization