Download

1 / 32
370 likes | 686 Views
DEB theory in ecotoxicology. Jan Baas, Tjalling Jager Vrije Universiteit Amsterdam dept. of Theoretical Biology. Time schedule. 10.00 – 11.00 modeling survival 11.00 – 12.30 working with data (DEBtox) 12.30 – 13.30 lunch 13.30 – 14.30 modeling sub lethal endpoints

E N D
DEB theory in ecotoxicology Jan Baas, Tjalling Jager Vrije Universiteit Amsterdam dept. of Theoretical Biology
Time schedule 10.00 – 11.00 modeling survival 11.00 – 12.30 working with data (DEBtox) 12.30 – 13.30 lunch 13.30 – 14.30 modeling sub lethal endpoints 14.30 – 16.00 working with data (DEBtox) 16.00 – 16.15 experimental setup 16.15 – 16.30 questions/evaluation If there are questions/remarks please interrupt!
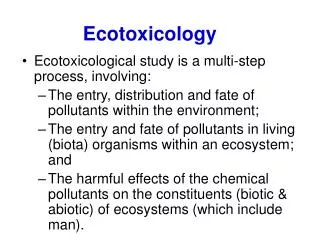
Contents Morning session • Modeling survival “Standard” approach Process based approach Mixture effects Afternoon session • Modeling sub lethal endpoints
LC50, NOEC, LOEC NOEC, LOEC are test concentrations. ECx is regression based
LC50, NOEC, LOEC No Observed Effect Concentration is a result from a statistical test. Or no statistically significant different effect from the control. High variation in the control means: NOEC>EC50 No observed effect is certainly not the same as no effect!! (Crane & Newman, 2000; van der Hoeven 2004)
LC50, NOEC, LOEC The regression model is purely empirical (not very important for an EC50, but of great importance for small effects like EC1)
LC50, NOEC, LOEC LC50, NOEC, LOEC all depend on the exposure time. If no effect is desired why not do no effect??
Alternatives KineticsDynamics External Concentration Effect Internal Concentration Biology based modeling
Alternatives • Consider toxicity as a process in time Questions: • why do effects change in time? • why do animals die after toxic exposure?
1 0.9 0.8 0.7 0.6 fraction surviving 24 hours 0.5 0.4 0.3 48 hours 0.2 0.1 0 0 0.1 0.2 0.3 0.4 0.5 0.6 0.7 concentration Change in time: survival Nonylphenol, survival
chemical B internal concentration chemical C time Why change in time? Part of the answer … • Internal concentration determines effect • Uptake takes time … chemical A
toxicokinetics model internal concentration time Process based • Effect depends on internal concentration • one-compartment model elimination rate
One compartment model Organism Internal concentration ke bu Environment External concentration Uptake dim (bu) mol/Cmol.M-1.h-1 Elimination: dim (ke) h-1 Bio concentration factor = bu/ke (cin,t=∞ /cex) mol/Cmol.M-1
lethal exposure ? Why do animals die? • “Standard” view: • death at certain threshold, different sensitivities lethal exposure ?? Newman & McCloskey (2000)
toxicokinetics model hazard rate NEC hazard rate blank value internal concentration Process based • Chemical affects the probability to die • hazard modelling killing rate survival probability
Internal concentration, hazard function and survival probability as function of time
Effect of Dieldrin onguppies Poecilia reticulata concentration dieldrin ( µg l-1) time 0 3.2 5.6 10 18 32 56 100 (d) 0 20 20 20 20 20 20 20 20 1 20 20 20 20 18 18 17 5 2 20 20 19 17 15 9 6 0 3 20 20 19 15 9 2 1 0 4 20 20 19 14 4 1 0 0 5 20 20 18 12 4 0 0 0 6 20 19 18 9 3 0 0 0 7 20 18 18 8 2 0 0 0
Example: survival dieldrin Elimination rate 0.73 d-1 Blank hazard rate 0.0064 d-1 NEC 2.8 (2.1-3.1) µg/L Killing rate 0.031 L/(µg d)
Mixtures Introduction Requirements for a mixture experiment: -) an experimental setup that allows for measurements at intermediate time points -) an experimental setup that allows to find interactions For soil dwelling organisms the standard protocol does not allow intermediate timepoints Possibilities: keep the organisms on compacted soil put in extra experiments to be taken out at different time points (requiring extra experimental effort)
Process based approach for mixtures An experiment was carried out with Folsomia candida, held on compacted soil. Counting of survivors for 21 days on each consecutive day.
Experiment and modeling the effects • Exposure to 6 binary mixtures of Cd, Cu, Zn and Pb • 6 concentrations of each metal (36 combinations) in a full factorial design Modeling effects on survival requires 8 parameters for a binary mixture: NEC, Killing rate and Elimination rate for each component Control mortality rate Interaction parameter
Survival for the Cu/Cd mixture No interaction in this mixture. Cu/Pb mixture slight antagonistic effect.
Results using single time point models Concentration Addition/Independent Action (Jonker et al ECT 2005) Results for the mixture of Copper and Cadmium Time point CA IA (days) 2 – 3 No interaction Synergism 4 – 5 Synergism Synergism 6 Synergism DL Synergism 7 – 9 DL Synergism DL Synergism 10 – 15 No interaction DL Synergism 16 DR Interaction DL Synergism 17 No interaction DR Synergism 18 – 21 Syn ld Antag hd DL Synergism
Interactions h0 = 0.005 1/d dAB = - 0.6 1/(µg/l)2 Parameters Compound A NEC = 5.0 µg/l Killing rate = 0.1 l/(µg d) Elimination rate = 0.5 (1/d) Parameters Compound B NEC = 0.3 µg/l Killing rate = 1.5 l/(µg d) Elimination rate = 1.5 1/d
Conclusions mixture experiment • Process based models are very suitable to model mixture effects on survival. • Interactions can be found • The model does not require an a-priori choice of mode of action (behavior of the NEC) and is easily extendable to more compounds in the mixture • Care should be taken when an interaction is assigned with single time point models as interactions vary in time
Concluding remarks experimental setup • The whole “effect-surface” must be covered when interactions are important to find • No preference for a full factorial design or a ray design • The more intermediate time points the better (preferably > 5) • The more test organisms per concentration the better (preferably > 10)
Concluding remarks • NOEC/ECx have limitations, NEC and killing rate are better summary statistics • change in time, do not allow extrapolations • Toxicity is a process in time • mortality is (largely) stochastic • A process-based approach is feasible • increase understanding of toxicity • supports all kinds of extrapolations
DEBtox software • Windows software, version 1.0 in 1996, version 2.0.2 in 2007 • Included in 2006 ISO/OECD guidance on statistical analysis of ecotox data • Only for standard test results, ‘user-unfriendly’ Matlab/Octave scripts for other applications OECD Braunschweig meeting 1996: Exposure time should be incorporated in data analysis Mechanistic models should be favoured if they fit the data
Hands-on! • Follow step-by-step manual • morning: survival • afternoon: growth and repro • Select a test data set • analyse with DEBtox • only single compounds …