Download
1 / 26
260 likes | 468 Views
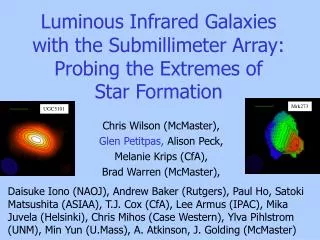
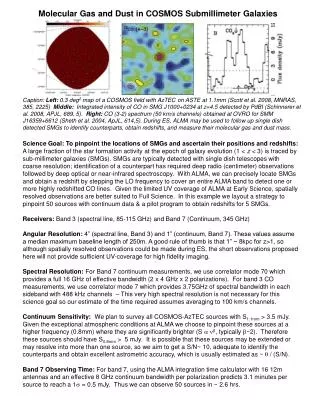
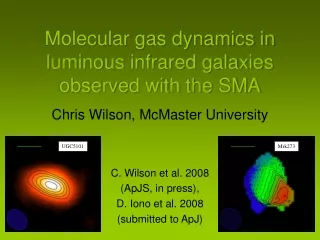
Molecular gas dynamics in luminous infrared galaxies observed with the SMA. Chris Wilson, McMaster University C. Wilson et al. 2008 (ApJS, in press), D. Iono et al. 2008 (submitted to ApJ). UGC5101. Mrk273. Molecular gas dynamics in luminous infrared galaxies.

E N D
Molecular gas dynamics in luminous infrared galaxies observed with the SMA Chris Wilson, McMaster University C. Wilson et al. 2008 (ApJS, in press), D. Iono et al. 2008 (submitted to ApJ) UGC5101 Mrk273
Molecular gas dynamics in luminous infrared galaxies • What are Luminous Infrared Galaxies? • An SMA Legacy Project: Gas Morphology and Dynamics in U/LIRGs • Comparison to high redshift sources • CO(3-2) correlates linearly with star formation rate (LFIR) • Gas surface density versus star formation rate • Sizes and line widths
The SMA U/LIRG Legacy Survey • Chris Wilson, Brad Warren, Adam Atkinson, Jen Golding (McMaster) • Glen Petitpas, Melanie Krips, T. J. Cox (CfA), Daisuke Iono (NAOJ), Alison Peck (ALMA) • Andrew Baker (Rutgers), Lee Armus (IPAC), Paul Ho, Satoki Matsushita (ASIAA), Mike Juvela (U. Helsinki), Chris Mihos (Case Western), Ylva Pihlstrom (New Mexico), Min Yun (Umass)
ULIRGS are galaxy mergers All galaxies with LFIR > 5x10¹¹ Lo are interacting or close pairs (Sanders et al. 1987) Figure from Galliano 2004 Scoville et al. 2000
Luminosity Source: Starbursts and AGN • 70-80% predominantly starbursts • 20-30% predominantly AGN Genzel et al. 1998
Gas Morphology and Dynamics in Luminous Infrared Galaxies: Sample Selection • Representative sample of 14 luminous (log(LFIR) > 11) and ultraluminous (log(LFIR) > 12) infrared galaxies • DL < 200 Mpc (resolution 1” ~ 1 kpc) • log(LFIR) > 11.4 • All with previous interferometric observations in the CO J=1-0 line
The Submillimeter Array • 8 x 6m antennas, maximum baseline 500 m • Dual frequency operation at 230, 345, 690 GHz • 2 GHz bandwidth = 1700 km/s at 345 GHz (880 micron) • Angular resolution of our survey is 1-4” (CO 3-2 and 880 micron continuum)
Centrally compact CO 3-2 emission I10565+2448 Mrk231 Mrk273 UGC5101 Arp55 (HST images of Arp55 and I10565+2448 from Evans, Vavilkin, et al., 2008, in prep.)
Velocity Fields within R<1 kpc Mrk231 Mrk273 I10565+2448 UGC5101 Arp55(NE) Arp55(SW)
ULIRGs are best local analogs to dusty galaxies at high redshift • Cosmologically significant population of very luminous dusty galaxies discovered at submm wavelengths • For z>0.5, 5 mJy at 850 m implies L > 8x10¹² Lo Ivison et al. 2000 Tacconi et al. 2006
High-redshift comparison sample • Select high-redshift objects with high resolution observations in CO(3-2) line • 12 submillimeter galaxies (SMGs) from z=2.2-3.1 (one at z=1.3) • 9 quasars from z=2.3-2.8 (one at z=6.4) • 2 Lyman Break Galaxies (LBGs) at z=2.7-3.1 • References for CO data: • SMGs: Genzel et al. 2003, Downes & Solomon 2003, Sheth et al. 2004, Greve et al. 2005, Tacconi et al. 2006, Iono et al. 2006 • Quasars: Downes et al. 1995, Barvainis et al. 1998, Guilloteau et al. 1999, Weiss et al. 2003, Walter et al. 2004, Beelin et al. 2004, Hainline et al. 2004, Solomon & van den Bout 2005 • LBGS: Baker et al. 2004, Coppin et al. 2007
CO(3-2) traces dense star forming gas • Slope (0.92+/-0.03) is similar to HCN (Gao & Solomon 2004) and significantly steeper than CO(1-0) (Yao et al. 2003)
Relation between gas surface density and far-infrared luminosity • Gas surface densities in Mo/pc2: • 1400 ± 350 U/LIRGs • 2290 ± 890 SMGs • 4280 ± 600 quasars • Surface density correlates with far-infrared luminosity • L’CO(3-2) to M(H2) using M(H2)=0.8L’CO(3-2) • assumes CO3-2/1-0=1 • Note surface densities are not corrected for inclination
Linewidths (FWHM) in four samples of galaxies • Average linewidths (FWHM, km/s) • 180 ± 10 local galaxies • 360 ± 30 U/LIRGs • 610 ± 90 SMGs • 310 ± 50 quasars • U/LIRG and quasar distributions similar (but no inclination corrections yet)
Star-forming galaxies at z~2 (Bouché et al. 2007) • SMGs have larger linewidths and are more compact than rest-frame optical and UV selected samples at z~2
Star-forming galaxies at z~2 (Bouché et al. 2007) • SMGs have larger linewidths and are more compact than rest-frame optical and UV selected samples at z~2 • Our work confirms local compact U/LIRGs fall in a similar part of the diagram to SMGs
L’CO(3-2) and LFIR correlated over 5 orders of magnitude CO(3-2) traces dusty star formation activity Star formation efficiency constant to within a factor of two Molecular gas disks in local U/LIRGs are more compact than SMGs and SMGs have broader line widths SMGs most similar to intermediate-stage mergers? broad lines due to violent mergers deep in massive halo potential Future Work: Spatially and velocity resolved physical conditions in gas Comparison with merger simulations Conclusions
Dynamical mass versus molecular gas mass • Average gas mass fraction: • 0.12+/-0.02 U/LIRGs • 0.37+/-0.09 SMGs • 2.0+/-0.5 Quasars • Mdyn uses R from gaussian fit and vc = vFWHM/2.4 • Inclination of 45 degrees assumed unless has been measured
Gas to dust ratio • Average gas-to-dust ratio • 179+/-44 U/LIRGs • 61+/-6 SMGs • 55+/-10 quasars • Dust masses assume • =1.5 cm2/g • TD=40 K for SMGS/quasars • TD from SED fits for U/LIRGs