Download
1 / 25
250 likes | 457 Views
Mass spectrometry-based proteomics. BMI/CS 776 www.biostat.wisc.edu/bmi776/ Spring 2018 Anthony Gitter gitter@biostat.wisc.edu. These slides, excluding third-party material, are licensed under CC BY-NC 4.0 by Anthony Gitter, Mark Craven, and Colin Dewey. Goals for lecture.

E N D
Mass spectrometry-based proteomics BMI/CS 776 www.biostat.wisc.edu/bmi776/ Spring 2018 Anthony Gitter gitter@biostat.wisc.edu These slides, excluding third-party material, are licensed under CC BY-NC 4.0 by Anthony Gitter, Mark Craven, and Colin Dewey
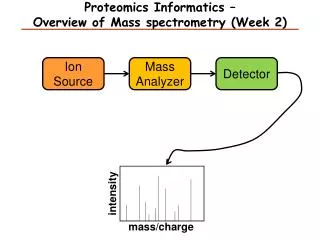
Goals for lecture Key concepts • Benefits of mass spectrometry • Generating mass spectrometry data • Computational tasks • Matching spectra and peptides
Mass spectrometry uses • Mass spectrometry is like the protein analog of RNA-seq • Quantify abundance or state of all (many) proteins • No need to specify proteins to measure in advance • Other applications in biology • Targeted proteomics • Metabolomics • Lipidomics
Advantages of proteomics • Proteins are functional units in a cell • Protein abundance directly relevant to activity • Post-translational modifications • Change protein state Phosphorylation in signaling Thermo Fisher Scientific Histone modifications Latham Nature Structural & Molecular Biology 2007; Katie Ris-Vicari
Estimating protein levels from gene expression • Correlation between gene expression and protein abundance has been debated • Gene expression tells us nothing about post-translational modifications Contribution to protein levels Li and BigginScience 2015
Mass spectrometry workflow Total ion chromato-gram Filter based on MS1 MS2 NesvizhskiiJournal of Proteomics 2010
Amino Acids • 20 amino acids • Building blocks of proteins • Known molecular weight • Common template Amino-terminal Carboxy-terminal Wikipedia, YassineMrabet
Peptide fragmentation Peptide bond • Select similar peptides from MS1 • Fragment with high energy collisions • Break peptide bonds Wikipedia, YassineMrabet Charge on amino-terminal (b) or carboxy-terminal fragment (y) Subscript = # R groups retained Steen and Mann Nat Rev MolCell Biol2004
Mass spectra MS2 MS1 Fragment and analyze one precursor ion Steen and Mann Nat Rev MolCell Biol2004 Mass-to-charge ratio Spectrum contains information about amino acid sequence, fragment at different bonds
From spectra to peptides NesvizhskiiJournal of Proteomics 2010
Sequence database search • Need to define a scoring function • Identify peptide-spectrum match (PSM) Steen and Mann Nat Rev MolCell Biol2004
SEQUEST • Cross correlation (xcorr) • Similarity between theoretical spectrum (x) and acquired spectrum (y) • Correction for mean similarity at different offsets Offsets Actual similarity Theoretical Acquired Eng, McCormack, Yates J Am Soc Mass Spectrom1994
Fast SEQUEST • SEQUEST originally only applied to top 500 peptides based on coarse filtering score Skip the 0 offset Eng et al J Proteome Res 2008
PSM significance • E-value: expected number of null peptides with score ≥ observed score • Compute FDR from E-value distribution • Add decoy peptides to database • Reversed peptide sequences • Used to estimate false discoveries
Target-decoy strategy NesvizhskiiJournal of Proteomics 2010 target PSMs above score threshold = Nt(ST) decoy PSMs above score threshold = Nd(ST)
Identifying proteins • Even after identifying PSM, still need to identify protein of origin Serang and Noble Stat Interface 2012
Mass spectrometry versus RNA-seq • RNA-seq • Transcript→ RNA fragment→ paired-end read • Mass spectrometry • Protein → peptides → ions → spectrum • Mapping spectra to proteins more ambiguous than mapping reads to transcripts • Spectra state space is enormous
Protein-protein interactions • Affinity-purification mass spectrometry • Purify protein of interest, identify complex members Smits and Vermeulen Trends in Biotechnology 2016
Protein-protein interactions • Mass spectrometry identifies proteins in the complex • Must control for contaminants MS2 Gingras et al Nature Reviews Molecular Cell Biology 2007
Post-translational modifications (PTMs) • Shift the peptide mass by a known quantity what-when-how
Phosphoproteomics example Sychev et al PLoS Pathogens 2017
Phosphoproteomics interpretation • Predict kinases/phosphatases for phospho sites Linding et al Cell 2007
Mass spectrometry replicates • Doesn’t identify all proteins in the sample • Data dependent acquisition has low overlap across replicates • Partly due to biological variation • New protocols to overcome this • Phosphorylation PTMs are especially variable • Grimsrud et al Cell Metabolism 2012 • 5 biological replicates • 9,558 phosphoproteins identified • 5.6% in all replicates
Data independent acquisition • Not dependent on most abundance signals in MS1 • Sliding m/z window DoerrNature Methods 2015
Mass spectrometry summary • Incredibly powerful for looking at biological processes beyond gene expression • Protein abundance • Post-translational modifications • Metabolites • Protein-protein interactions • Typically reports relative abundance • Labeling strategies for comparative analysis • Compare relative abundance in multiple conditions • Missing data was a big problem, but improving • Fully probabilistic analysis pipelines are not the most popular tools • Arguably greater diversity in software than RNA-seq