Download
1 / 18
180 likes | 409 Views
Smart Grid Overview. Keith Dodrill Program Analysis Support Team June 7, 2010. Agenda. Case for Grid Modernization Smart Grid Vision, Technologies, & Metrics What’s the Value Proposition? Change Management – “Performance Feedback” Smart Grid Activities Questions.

E N D
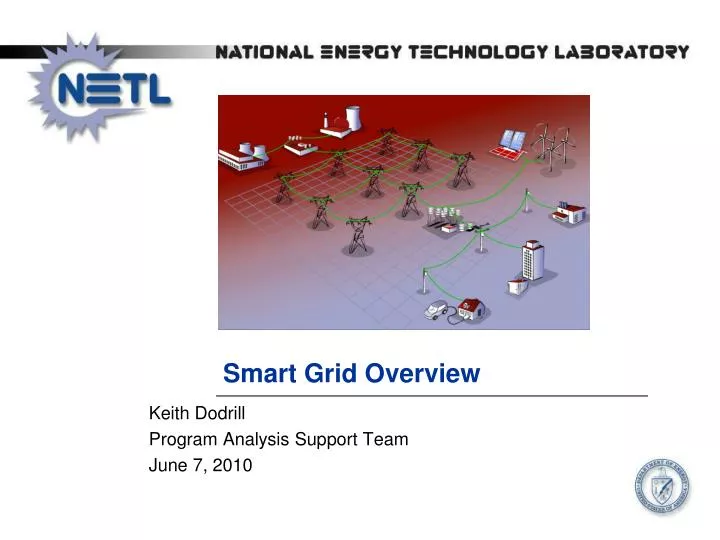
Smart Grid Overview Keith Dodrill Program Analysis Support Team June 7, 2010
Agenda Case for Grid Modernization Smart Grid Vision, Technologies, & Metrics What’s the Value Proposition? Change Management – “Performance Feedback” Smart Grid Activities Questions
Why Modernize the Grid? 3 • Today’s grid is aging and outmoded • Unreliability is costing consumers billions of dollars • Today’s grid is vulnerable to attack and natural disaster • An extended loss of today’s grid could be catastrophic to our security, economy and quality of life • Today’s grid does not address the 21st century power supply challenges • Adverse trends associated with the grid - Costs, reliability, peak loads, asset underutilization, TLRs, grid divorce • The benefits of a modernized grid are substantial
Today’s grid – Status quo is not an option • Aging • 70% of transmission lines are 25 years or older • 70% of transformers are 25 years or older • 60% of circuit breakers are 30 years or older • Outmoded • Designed in the 50s and installed in the 60s and 70s, before the era of the microprocessor. • Stressed • Never designed for bulk power shipments • Wholesale power transactions jumped 300% from 2000 to 2005. Insight Magazine, Oct. 2005
What’s different with the Smart Grid? ...for all Stakeholders Smart Grid is a Vision and a System • De-centralized supply and control • Two-way power flow • Two-way information flow • Consumer engagement with resources to solve power issues locally • Imperative to transform from passive to active control in Distribution Creating the intelligence and capability to optimize: • Reliability • Security • Economics • Efficiency • Environment • Safety
Smart Grid Principal Characteristics 7 7 The Smart Grid will: • Enable active participation by consumers • Accommodate all generation and storage options • Enable new products, services and markets • Provide power quality for the digital economy • Optimize asset utilization and operate efficiently • Anticipate & respond to system disturbances (self-heal) • Operate resiliently against attack and natural disaster
Smart Grid Metric Map Value Areas Principal Characteristics Key Technology Areas Build Metrics Impact Metrics Research Metrics
Smart Grid Metrics 9 Reliability Outage duration and frequency, momentary disruption, power quality Security Ratio of distributed generation to total generation Economics Electricity prices, transmission congestion costs, cost of outages Efficient T&D electrical losses, peak-to-average load ratio Environmentally Friendly Ratio of renewable generation to total generation, emissions per kwh Safety Injuries and deaths to workers and public
Benefit of Modernization $1294 – 2028 Billion Overall benefit-to-cost ratio of 2.8 to 6.0 ValueProposition EPRI, 2011 • Previous Studies • Benefit to Cost Ratio for West Virginia of 5:1 • Benefit to Cost Ratio for San Diego of 6:1 • Benefit to Cost Ratio for EPRI (2004) 4:1-5:1 • $165 B Cost • $638 - $802 B Benefits Cost to Modernize • $338-$476B over 20 years • $ 82-90 B for transmission • $232-$339 B for distribution • $24-46 B for consumer • $17-24 B per year EPRI Report: http://www.smartgridinformation.info/pdf/3272_doc_1.pdf
Who are the Beneficiaries? We get what we reward! Utilities (What’s in it for my shareholders?) Consumers (What’s in it for me?) Society (What’s in it for us?)
Progress won’t be “smooth and easy” Experience sharing can greatly improve the change process We can expect: • Not all technologies will work as planned • Software issues will arise • “Myths and legends” will emerge that impede progress • Unexpected events will occur • Workforce training weaknesses will become apparent • Progress may not be achieved at the expected rate • Some benefits will not be realized as expected • Good ideas and practices will be identified
Managing the Change to the Smart Grid Well Underway in SG Transition Create Vision / Concepts Understanding Communicate / Debate Alignment with SG Concept Value Proposition Motivation to Invest Plan and Deploy Achieve Results “Case Studies” Performance Feedback More Emphasis is Needed in SG Transition Best Practice / Lessons Learned Corrective Action Modify Plans Continuously Improve Achieve Vision Success Results are being achieved! 13
Achieving the Smart Grid Vision Phase 1 is “getting started” — Phase 2 is “getting done”
PFP Closes the Feedback Loop End Beginning Updated 02/25/2008 Performance Feedback Loop
Current Smart Grid Activities American Recovery and Reinvestment Act • Smart Grid Investment Grants (100 projects) • $3.4 billion Federal; $4.7 billion private sector • 877 PMUs covering almost 100% of transmission • 200,000 smart transformers • 700 automated substations • 40 million smart meters • 1 million in-home displays • Smart Grid Demonstration Projects (32 projects) • $620 million Federal; $1 billion private sector • 16 storage projects • 16 regional demonstrations
Current Smart Grid Activities (continued) • Additional ARRA Smart Grid Activities • Interoperability Framework by NIST ($10M) • Transmission Analysis and Planning ($80M) • State Electricity Regulator Assistance ($50M) • State Planning for Smart Grid Resiliency ($55M) • Workforce Development ($100M) • DOE Renewable & Distributed Systems Integration • EPRI Smart Grid Demonstrations (12 projects) • Smart Grid System Report to Congress • http://www.smartgrid.gov/resources
References Smart Grid Implementation Strategy www.netl.doe.gov/smartgrid/index.html Federal Smart Grid Website www.smartgrid.gov Smart Grid Clearinghouse www.sgiclearinghouse.org/