Download
1 / 13
250 likes | 453 Views
Statistical Exploratory Analysis with “EnQuireR”. Introduction Installation How to Report. Descriptive analysis & Exploratory analysis. 1. Introduction. Example: a frequency distribution chart. 1. Descriptive statistic are mostly “Univariate analysis”.

E N D
Statistical Exploratory Analysis with “EnQuireR” • Introduction • Installation • How to • Report
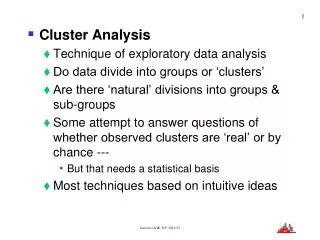
Descriptive analysis & Exploratory analysis 1. Introduction Example: a frequency distribution chart 1. Descriptive statistic are mostly “Univariate analysis”. It involves the examination across cases of a single variable, focusing on three characteristics: the distribution; the central tendency; and the dispersion Example: Multivariate cluster analysis from three measurements of femur properties 2. Exploratory analysis is an approach to analyzing data for the purpose of formulating hypotheses. “Multivariate or Factor analysis” are used to uncover the latent structure (dimensions) of a set of variables. It reduces attribute space from a larger number of variables to a smaller number of factors and allows the definition of statistically consistent cluster. source From Wikipedia
EnQuireR: a dedicated package in the R environment 1. Introduction “R” is a free software environment for statistical computing and graphics. (http://www.r-project.org ) – It is the Open Source Equivalent of SPSS, SAS or STATA – Mostly used in University – Free support over various forums. EnQuireR is a “R” package that allows the statistical exploration of data issued from questionnaires (http://enquirer.free.fr/EnQuireR.pdf; http://cran.r-project.org/web/packages/EnQuireR/EnQuireR.pdf) Multiple Correspondence Analysis (MCA) : A type of multivariate analysis that allows to “Summarize the pattern of relationships between different categorical variables”
A few download (all Free & Open source) 2. Installation • http://lib.stat.cmu.edu/R/CRAN/bin/windows/base/ (direct download) =>The R environment • http://www.texniccenter.org/resources/downloads/29 (direct download) => Used to generate PDF • http://miktex.org/2.9/setup (direct download) => Used to generate PDF • http://enquirer.free.fr/ (direct download) => The specific R package for questionnaire analysis • Install the first 3 applications!
Installation 2. Installation If you are behind a proxy, add “–internet2”to your exe shortcut “R” will then use the same proxy as your local Internet Explorer
Setting up a “Working Directory” 3. How to Start from your customized shortcut This is the “R shell” Change the working directory with “setwd()” (here D:/stat) To check your working directory, enter: getwd()
Install the local package “EnquireR” 3. How to
Load the library to start R Commander 3. How to Enter library(“EnQuireR”) in the R shell This will open a new window for the “R Commander” console
Load your dataset 3. How to In R commander, import a new dataset Enter your-dataset-name Select the excel file in your file system. Select your worksheet in the excel document
Start the analysis 3. How to Your data has been loaded. Note that column name may have been automatically renamed Enter: “res.enmca <- ENMCA(your-dataset-name, report=TRUE) “ Click “Submit” Wait… this a lot of computation !!! A directory named "EnQuireR" has been created in your working directory with all your reports
Get your reports 4. Report • The EnQuireR package provides two kinds of automatically generated reports: • A synthetic report made of slides and divided in 2 parts: • Multivariate exploration of the questionnaire • Typology of the individuals. • A detailed and exhaustive report: • Indicates whether a given set of categorical variables depends on another one. • Definition of the axis of the correspondence map • Spreading of individuals and categories in the correspondence map. • List of categories that best describe each automatically defined cluster
Requirement on data 4. Report • Data should be “categorical” (i.e. non continuous), typically closed response questions • Categories should have more than one level • Data should not contain space – to be replaced by point for instance • Column names should be as short as possible to be better visualized in the final report
Usage for UNHCR 4. Report • Analysis could be performed on: • Registration data (proGres) • IDP profiling • Site assessment (needs assessment) • Possibility to define the characteristics of statistically homogenous groups. • Those characteristics can then be used to build targeted assistance programme! Examples of case studies can be found here: http://enquirer.free.fr/case-studies/