Download
1 / 27
270 likes | 432 Views
Demand, Supply and Price Theory . Week 2. Recap. What is opportunity Cost? Why are incentives important to policy makers? Why isn’t trade amongst countries a game with winners and losers? Why is productivity important? What is the relationship between Marginal Benefit and Marginal Cost.

E N D
Recap • What is opportunity Cost? • Why are incentives important to policy makers? • Why isn’t trade amongst countries a game with winners and losers? • Why is productivity important? • What is the relationship between Marginal Benefit and Marginal Cost
The Scientific Method • Economics is a Science • Economists devise theories, collect data and analyze it • Scientific economists make positive statements Develop a model based on simplified assumptions Collect data and test models Identify the problem
Three Economic Mode • The Circular Flow Diagram • The production possibilities frontier • Market equilibrium
The Circular flow diagram • “A visual model of the economy that shows how money flows through markets amongst households and firms”
Production Possibilities Frontier • A graph that shows the combinations of output that the economy can possibly produce given the available factors of production and the available production technology. • Example • Economy can produce 300 shirts or 100 cakes • Producing at the PPF causes the market to be “efficient” • It is easy to see trade offs and opportunity costs • Opportunity Cost = the slope of the PPF Line • Slope = Change in Y/ Change in X • 300-0/100/0 = 3
Markets and Competition • What happens • To the price of petrol when war breaks out in Iran • To the price of mangoes when farmers have an abundant year • To the number of tourists when the tsunami hit Sri-Lanka • All of the above show the workings of Supply and Demand • Supply and Demand are the forces that make market economies work. • They determine the following • Quantity of Goods produced • Price of which goods are sold
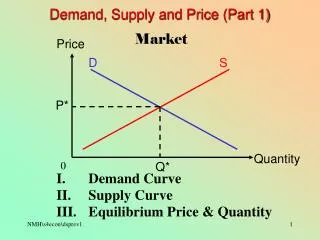
What is a Market? • A group of buyers and sellers of a particular good or service. • Characteristics of markets • Organized markets • Less Organized markets. • A competitive market is a market which has many buyers and sellers so that each has a negligible impact on price. • For today’s class we will assume that markets are perfectly competitive. • The goods offered for sale are exactly the same so that no single buyer or seller has influence over price.
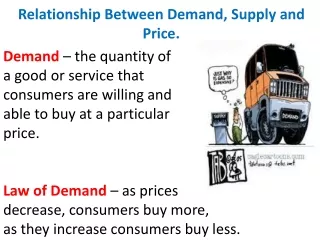
Demand • Quantity Demanded – the amount of a good that buyers are willing and are able to pay. • Market Demand – the sum of all individual demand for a particular good or service Law of Demand The claim that other things equal the quantity Demanded of a good falls when the price of The good increases.
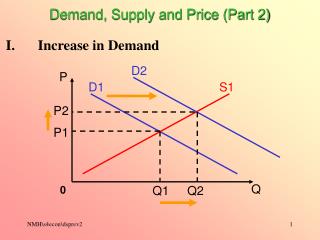
Demand • Shifts in the demand curve • Demand curves can shift • To the RIGHT (A) • To the LEFT (B) • Shifts to the right means demand has • increased • Shift to the left means demand has • decreased
Variables that cause Demand Curves to shift • Income • Prices of Related goods • Tastes • Expectations • Number of Buyers
Income • Normal goods • A good for which other things equal an increase in income leads to an increase in demand • Inferior Good • A good for which other things equal an increase in income leads to a decrease in demand.
Price of Related Goods • Substitutes • Two goods for which an increase in price of one leads to an increase in demand for the price of the other • Complements • Two goods for which an increase in the price of one leads to a decrease in demand for the other.
Supply • Quantity Supplied • The amount of a good that sellers are willing and able to sell. Law of Supply The claim that other things equal the quantity Supplied of a good increase when the price of The good increases.
Supply • Shifts in the Supply Curve • Shifts to the right increase supply • Shifts to the left decrease supply
Variables that cause the supply curve to shift • Input Prices • Costs of inputs. If they increase production decreases, if they decrease production will increase • Technology • Machinery increases productivity • Expectation • Number of Sellers
Market Equilibrium • Equilibrium – A situation which the market price has reached the level at which quantity supplied equals the quantity demanded. • Equilibrium price – the price that balances Qd and Qs • Equilibrium quantity – the quantity that balances Pd and Ps Law of Supply and Demand The claim that the price of any good adjusts to bring the Qd and the Qs for the good into balance.
Surplus and Shortage • Surplus – A situation where Qs is greater than Qd • Shortage – A situation where Qd is greater than Qs
Elasticity of Supply and Demand Price Elasticity of Demand • We use absolute numbers even though Qd is negatively related to its price. • |Ped|= △Q/△P = 20/10 = 2
Different Types of Demand • Perfectly Inelastic Demand • Inelastic Demand • Unitary Elastic Demand • Elastic Demand • Perfectly Elastic Demand
Determinants of Price Elasticity • Sustainability • Nature of the Product • Proportion of Income • Definition of Market • The Possibility of new purchases • Time Horizons • Addiction • Complementary goods • Price expectations
Income Elasticity of Demand • A measure of how much the quantity demanded for a good responds to a change in consumers income.
(Ey) • Negative elasticity • Ey>0 – D decreases as I increases • Zero Income Elasticity • Ey=0 – D does not change as I rises of falls • Income Inelastic Demand • 0<Ey<1 – D rises at a smaller proportion than I • Unit Income Elasticity • Ey=1 – D rises exactly the same proportion as I • Income elastic demand • 1<Ey<∞ - D rises at a greater proportion than income
The Cross Price Elasticity of Demand • The measure of how much the quantity demanded of one good responds to a change in the price of another good.
Price Elasticity of Supply • Es = △Q/Q = △Q x P △P/P △P Q
Determinants of Elasticity of Supply • Time • Excess Supply or Unsold Stock • Factor Mobility • Natural Constraints • Risk Taking