Download
1 / 11
110 likes | 269 Views
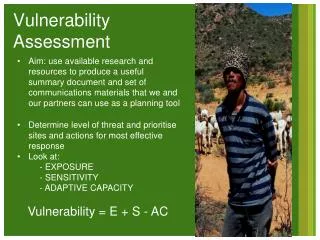
Approaches to a VULNERABILITY Assessment. Sylvia Prieler May 26, 2004 Land Use Project IIASA. Vulnerability approach. Define scope Qualitative - CONCEPTUAL FRAMEWORK general; case specific Quantitative – a) Determine INDICATORs b) Methodology Strategies to reduce vulnerability.

E N D
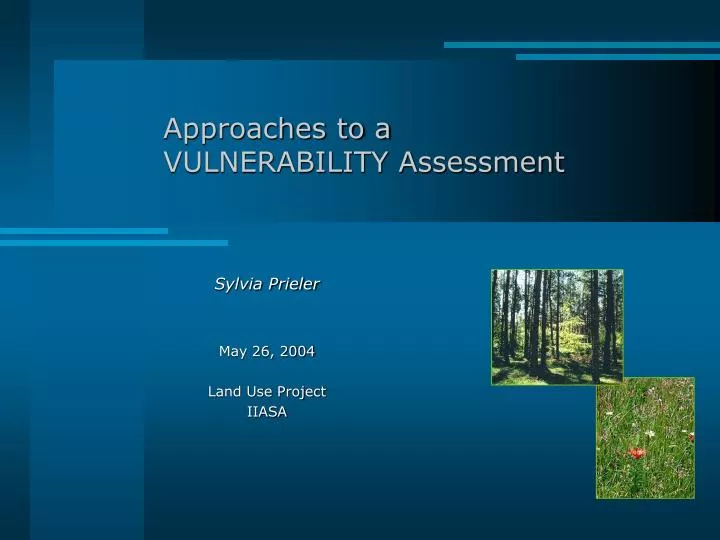
Approaches to aVULNERABILITY Assessment Sylvia Prieler May 26, 2004 Land Use Project IIASA
Vulnerability approach • Define scope • Qualitative - CONCEPTUAL FRAMEWORK general; case specific • Quantitative – a) Determine INDICATORs b) Methodology • Strategies to reduce vulnerability Climatic variability - impact on agricultural production – vulnerability of the people Where are people most vulnerable to climatic variability and why?
Qualitative CONCEPTUAL FRAMEWORK
Qualitative Key issues in CONCEPTUAL FRAMEWORK Climate variability Agric. Prod. variability LAND People rural/urban WATER ECONOMY Policy & INSITUTIONS
Qualitative People - URBANIZATION • Surplus rural laborestimates are 30% or 120-150 mio. • Income disparity between rural and urban areasper capita annual disposable income: factor 2.2 (1994 and 2000) MIGRATION to urban areas Population in 2001: Rural: 796 mio. (62%) Urban: 481 mio. (38%)
Qualitative People - URBANIZATION • Government promotes urbanization • WTO membership • Future: increasing urbanization Scenarios: by 2030 at 55 to over 60% • Challenge: • loss of cultivated landgood arable land; farmers loose their farmland (estimates at 1.5 mio. every year in last decade)ratio: cultiv. land / rural labor is decreasing • Increasing water demand of urban household
Quantitative INDICATORS • Proxy indicators for describing agricultural production variability • aridity index; length of growing period; • rainfed potential grain production; • actual grain productiona) rainfed b) irrigated
Quantitative INDICATORS
Quantitative INDICATORS - Methodology • Quantify by ranking across the country • Use threshold given by certain ‘sustainability indicators’cultiv. land / capita (0.4ha/capita) • GIS overlay techniquesformulate relevant questions:LGP < 180 + LGP CV > 5% + irrig.share < 60% + ….Where are these areas?How many people are affected by such conditions?
Quantitative INDICATORS - Methodology Distribution of ARIDITY INDEX(average climatic conditions) Population living in areas classified as Semiarid Environments (0.2<=P/ ET0<0.5)