Download
1 / 37
370 likes | 526 Views
First MINOS Results from the NuMI Beam. Simona Murgia Stanford University PHENO 2006 Madison, WI, May 15-17 2006 for the MINOS Collaboration.

E N D
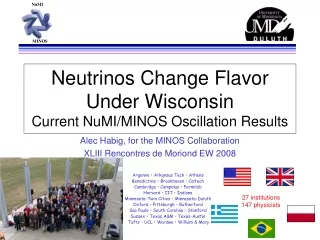
First MINOS Results from the NuMI Beam Simona Murgia Stanford University PHENO 2006 Madison, WI, May 15-17 2006 for the MINOS Collaboration Argonne • Athens • Benedictine • Brookhaven • Caltech • Cambridge • Campinas • Fermilab College de France • Harvard • IIT • Indiana • ITEP-Moscow • Lebedev • LivermoreMinnesota-Twin Cities • Minnesota-Duluth • Oxford • Pittsburgh • Protvino • Rutherford Sao Paulo • South Carolina • Stanford • Sussex • Texas A&M Texas-Austin • Tufts • UCL • Western Washington • William & Mary • Wisconsin Simona Murgia - PHENO06
Outline • Neutrino oscillations • Oscillations at Dm2atm: Super-K, K2K,MINOS • MINOS • NuMI/MINOS overview • Start-up and running • Oscillation analysis • Results • Summary Simona Murgia - PHENO06
Oscillation Physics • There is experimental evidence that neutrino flavor is not conserved and thus neutrinos have non-zero masses. • A neutrino of flavor a=e,m,t is a superposition of mass eigenstates described by the lepton mixing matrix U: sij=sinqij,cij=cosqij |Uai|2: probability that ni interaction will produce n of flavor a • In the two-flavor approximation: →L/E determines what Dm2 is probed Simona Murgia - PHENO06
Neutrino Mass Spectrum Normal Hierarchy Inverted Hierarchy n n 3 2 n 1 Dm2atm n 2 Dm2sol n 1 3 n n n n m t e |Umi|2 |Uei|2 |Uti|2 (3 mass eigenstates - assume no nsterile) Two mass splittings: Large (Dm2atm ): Atmospheric (up-down asymmetry) Long baseline Small (Dm2sol ): Solar + reactor • |Ue3|2 is not known (bounded by reactor expts) and neither is the mass hierarchy. • Solar data suggests |Ue2|2~1/3, and thus|Ue1|2~2/3 (unitarity and small |Ue3|2 ). • Also, data suggests nm nt dominant at Dm2atm and maximal mixing angle, • |Umi|2~|Uti|2 With L/E~103 MINOS is sensitive to Dm2atm This scale will be the focus of this talk Simona Murgia - PHENO06
Super-Kamiokande Ref. hep-ex/0501064, T. Kajita WHEPP9 • Neutrinos produced by the interaction of primary cosmic rays in the Earth’s atmosphere. Wide range of energies and travel distances. • Measurement relies on knowledge of flux w/o oscillations 2,700 m.w.e. overburden 50 kT water Cherenkov detector Simona Murgia - PHENO06
Super-K (I+II) – Zenith Up Down Unoscillated MC Best fit: Dm223 = 2.5x10⁻³ eV2, sin22q23=1 Data 90% CL: 2.1 < Dm223< 3.0×10⁻³eV2 sin22q > 0.93 (preliminary) (preliminary) Simona Murgia - PHENO06
Super-K (I+II) – L/E SK-I+II (preliminary) SK-I+II (preliminary) Decoh. Decay Osc. • Consistent with Zenith angle analysis results. • At 90% CL:2.0 < Dm223 < 2.9 ×10⁻³eV2 , sin22q23> 0.92 Simona Murgia - PHENO06
K2K Ref. hep-ex/0411038, hep-ex/0512041 • First long baseline accelerator neutrino experiment. • Accelerator produced nm beam (1.3 GeV mean energy) travels 250 km toward Super-K. The near detector is located 300 m from the production target. • Observe energy dependent nm disappearance. Super-K Δm2=0.003eV2 , L=250km En (GeV) Near Detectors (SciBar, 1 kton water Cherenkov) Simona Murgia - PHENO06
K2K - Results • Observe deficit of nm at SK and distortion in the energy spectrum: • Well described by nm ntoscillation 112 events at SK, expect 0.922x10²⁰ POT MC normalization: number of events (preliminary) En(GeV) Best fit: Dm223 = 2.76 x 10⁻³ eV2, sin22q23= 1 For sin22q23= 1: 90% CL 1.9 < Dm223<3.5x10⁻³ eV2 Simona Murgia - PHENO06
MINOS Main Injector Neutrino Oscillation Search n Monte Carlo 735 km 1 2 MINOS is a long baseline neutrino experiment • n produced at Fermilab travel in the direction of Soudan, MN, 735 km away. • Measure the neutrino energy spectrum at Soudan, MN, site of the MINOS far detector and compare it to the unoscillated spectrum prediction from the near detector, 1km from the target. 2 1 spectrum ratio Simona Murgia - PHENO06
NuMI Beamline • 120 GeV protons from the Fermilab Main Injector • Up to 4x10¹³ protons every 1.9 sec • 0.4 MW average beam power • Single turn extraction (10 ms) Simona Murgia - PHENO06
NuMI Target and Horns ASSEMBLED HORN #1 TARGET HORN #2 • Target: 6.4x15 mm2 graphite segments. • Two parabolic focusing horns (3T at 200kA). • The relative position of the target and the focusing horns allows running in different energy configurations • sensitive to different values of the oscillation parameters and non-oscillation models • study systematics and tune simulation Simona Murgia - PHENO06
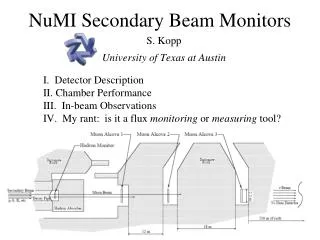
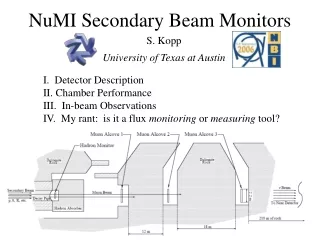
Hadron and Muon Monitors BEAM MONITORING DECAY PIPE HADRON MONITOR MUON MONITOR Parallel plate ionization chambers monitor hadron and muon content of secondary beam Simona Murgia - PHENO06
The MINOS Detectors Far Detector, Soudan, MN Near Detector at Fermilab, IL 735 km • Near and Far detectors have same basic design, with alternating layers of 2.54 cm thick steel and 1 cm thick solid scintillator (extruded polystyrene) • Magnetized to 1.2 T 980 tons, 105 m underground 282 steel and 153 scintillator planes nbeam 5400 tons, 710 m underground 486 steel and 484 scintillator planes nbeam • Scintillator planes segmented in 4.1 cm wide strips embedded with WLS fibers. • The orientation of the strips in adjacent planes is orthogonal • Multi-anode Hamamatsu PMT (64-channel at near det and 16-channel at far det) optical readout. Simona Murgia - PHENO06
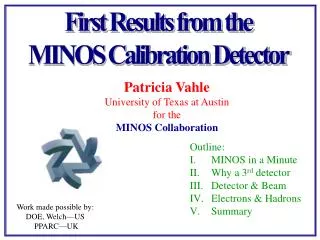
Calibration • Calibration of ND and FD response using: • Light Injection system (PMT gain) • Cosmic ray muons (strip to strip and detector to detector) • Calibration detector (overall energy scale) • Energy scale calibration: • 1.9% absolute error in ND • 3.5% absolute error in FD • 3% relative Simona Murgia - PHENO06
Start-Up and Running • NuMI operations underway in December 2004 • First neutrinos recorded in early 2005: Near Detector, Jan 2005 - Far Detector, Mar 2005 Average intensity (15 Oct to 31 Jan): 2.3 x 10¹³ protons every 2.2 sec Integrated POT in 1 year running 1.39 x 10²⁰ POT Simona Murgia - PHENO06
Neutrino Energy Spectrum LE pME pHE • Running in different energy configurations has been achieved by moving the target. • 1.5 x 10¹⁸ POT in pME and pHE configurations early in the run. • Target in LE-10 configuration (sensitive to favored Dm223 ) Beam composition: 98.5% nm+nm (6.5% nm), 1.5% ne+ne Events in fiducial volume Simona Murgia - PHENO06
Oscillation Analysis • The beam nm disappearance analysis was performed using data collected between May and Dec 2005. • The data sample corresponds to 0.93 x 10²⁰ POT. • The analysis was performed by blinding an unknown fraction of far detector events (based on event length and total energy deposition) • The near detector data remained unblinded. • Extensive quality checks of the near and far (open) data were performed. • The data selection and analysis procedure were finalized before unblinding the far detector data in early March, 2006. Simona Murgia - PHENO06
Event Topologies nm CC Event NC Event UZ VZ 3.5m 1.8m 2.3m ne CC Event Short, with typical EM shower profile Long m track + hadronic activity at vertex Short event, often diffuse Monte Carlo En= Eshower+Pm 55%/E 6% range, 10% curvature Simona Murgia - PHENO06
Data Selection FAR DETECTOR NEAR DETECTOR n Calorimeter Spectrometer nmCC-like selection: • Events with at least one good reconstructed track. • Track vertex within the fiducial volume of the detector: NEAR:1m < z < 5m (z from front face) FAR: z>50cm from front face R< 1m from beam center z>2m from rear face R< 3.7m from center of detector 3. Fitted track should have negative charge (selects nm) 4. Discriminate NC background based on Particle ID parameter (next two slides). Fiducial Volume Simona Murgia - PHENO06
Selecting CC events • Further NC background reduction is achieved by assigning to each event CC-like and NC-like probabilities. • Pm and PNC are based on three input Probability Density Functions (PDFs) that differ for True CC and NC interactions: • Event length in planes • Fraction of event pulse height in the reconstructed track • Average track pulse height per plane Simona Murgia - PHENO06
CC Selection Efficiencies • The Particle ID (PID) parameter is defined as: • Optimized CC-like cuts: PID>-0.2 at FD, PID>-0.1 at ND • NC contamination limited to Evisible<1.5 GeV • Selection efficiency is quite flat as a function Evisible. MC MC CC-like Simona Murgia - PHENO06
Near Detector Distributions Reconstructed track angle with respect to vertical Distribution of reconstructed event vertices in the x-y plane Beam points down 3 degrees to reach Soudan Reconstructed y vertex (m) Fiducial region Partially instrumented planes Detector outline Area normalised Reconstructed x vertex (m) Very large near detector data sample (~107 events in the fiducial volume for 1020 pot) allows detailed Data/MC comparison and better understanding of detector performance. Vertex Z Simona Murgia - PHENO06
Near Detector - PID Distributions Event length Track PH per plane Calorimeter/ spectrometer boundary LE-10 Track PH fraction Simona Murgia - PHENO06
Hadron Production Tuning LE-10 events Good agreement between data and Fluka05 Beam MC. Better agreement obtained by tuning the MC by fitting to hadronic xFand pT. LE-10/185kA pME/200kA pHE/200kA LE-10/Horns off Weights applied as a function of hadronic xF and pT. Not used in the fit Simona Murgia - PHENO06
Far Detector Data • The far detector n events used for the oscillation analysis have timing consistent with the spill. Event time-stamping provided by GPS units. • Easily separated from cosmic muons (0.5 Hz) using topology (upper limit on cosmics background in open sample: 1.7 events 90% C.L.) Simona Murgia - PHENO06
Observed/Expected Rates • 33% deficit of events between 0 and 30 GeV with respect to the no oscillation expectation is observed. • Numbers are consistent for nm+nm sample and for the nm-only sample • The statistical significance of this effect is 5 standard deviations Simona Murgia - PHENO06
Far Detector - PID Distributions Track Length Track Pulse Height per Plane Particle Identification Parameter Simona Murgia - PHENO06
Far Detector -Physics Distributions Muon Momentum (GeV/c) Shower Energy (GeV) y = Eshw/(Eshw+Pm) Simona Murgia - PHENO06
Predicting the Far Detector Spectrum • Use the Near detector data to perform the extrapolation between Near and Far. • Monte Carlo provides necessary corrections for energy smearing and acceptance. • Use our knowledge of pion decay kinematics and the geometry of our beamline (extended neutrino source, seen as point-like from the Far Detector) to predict the Far detector energy distribution from the measured Near detector distribution • This method is known as the “Beam Matrix” method. p+ to far Detector (stiff) target qf p+ qn (soft) Decay Pipe ND Simona Murgia - PHENO06
Beam Matrix Method FAR NEAR • Beam Matrix encapsulates the knowledge of pion 2-body decay kinematics & geometry. Simona Murgia - PHENO06
Predicted Spectrum 0.93e20 pot Predicted spectrum Nominal MC Predicted FD unoscillated spectra • The Far Detector, unoscillated spectrum as predicted by the beam matrix method. • Excess in the high energy tail carried over from the near detector true spectrum. Predicted FD unoscillated spectra • Three alternative methods were used • to predict the far det spectrum. • Different sensitivities to systematics. • Very good agreement. Simona Murgia - PHENO06
Oscillation Parameters Simona Murgia - PHENO06
Ratio Data/MC and Allowed Regions • The results of the four different extrapolation methods are in excellent agreement with each other. Simona Murgia - PHENO06
Systematic Errors • Systematic shifts in the fitted parameters have been computed with MC “fake data” samples for Dm2=0.003 eV2, sin22q=0.9 for the following uncertainties Simona Murgia - PHENO06
Outlook • Perform precise (<10%) measurements ofDm223andsin22q23. • Search for sub-dominantnmneoscillations well below the current exclusion limit. • Test/rule out alternate models such as neutrino decay, sterile neutrinos. nmdisappearancenmne Simona Murgia - PHENO06
Summary • The first MINOS accelerator-based neutrino oscillation analysis from a 0.931020 POT exposure has been performed. • 5 s evidence of nm disappearance has been observed. • The result is well described by nm oscillations with: • If sin22q23 is fixed to one, the best fit result is: • Systematic uncertainties are well under control. • Increasing POT will greatly improve the accuracy. • Total exposure to date is 1.4 1020 POT. Simona Murgia - PHENO06