Download
1 / 34
390 likes | 645 Views
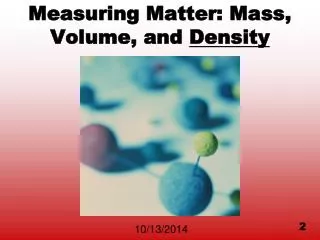
Elementary Essential Lab Mass, Volume, & Density. Science Capacity Development & School Reform Accountability Presenter: Annmarie Dilbert. Agenda. Lab Norms Bellringer Sunshine State Standard Engage - BrainPOP Explain – Background Knowledge Explore - Lab Elaborate Evaluate Gizmo.

E N D
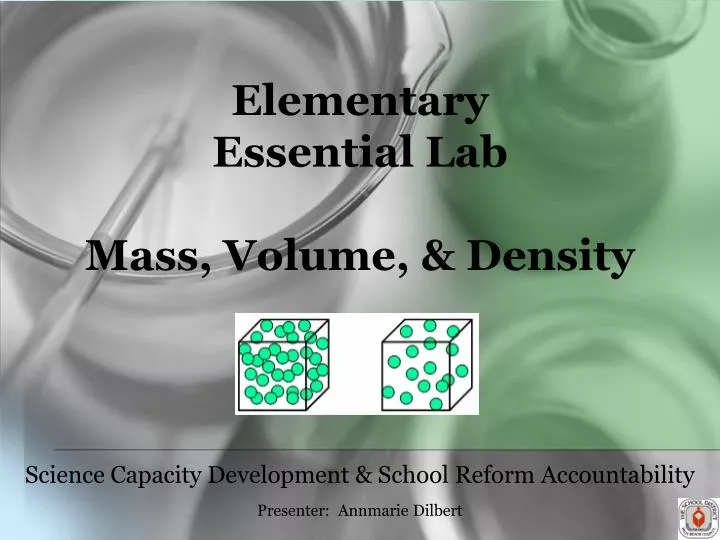
ElementaryEssential Lab Mass, Volume, & Density Science Capacity Development & School Reform Accountability Presenter: Annmarie Dilbert
Agenda • Lab Norms • Bellringer • Sunshine State Standard • Engage - BrainPOP • Explain – Background Knowledge • Explore - Lab • Elaborate • Evaluate • Gizmo
Lab Norms 1. Be responsible. 2. Follow ALL instructions carefully. 3. Please avoid touching any equipment, chemicals, or other materials in the laboratory area until you are instructed to do so. • Avoid eating food, drinking beverages, or chewing gum in the laboratory. • Dress properly during a laboratory activity : safety goggles, lab coats, long hair tied back, no sandals, no dangling jewelry.
Gummy Bear Lab Florida Sunshine State Standard Benchmark: SC.A.1.2.1 The student will determine that the properties of materials (e.g., density and volume) can be compared and measured (e.g., using rulers, balances, and thermometers) Additional Florida Sunshine State Standard Benchmarks: SC.H.1.2.1: The student knows that it is important to keep accurate records and descriptions to provide information and clues on the causes of discrepancies in repeated experiments. SC.H.1.2.2: The student knows that a successful method to explore the natural world is to observe and record, and then analyze and communicate the results. SC.H.3.2.4: The student knows that through the use of science processes and knowledge, people can solve problems, make decisions, and form new ideas.
ENGAGE BrainPOP http://www.brainpop.com/science/matterandchemistry/measuringmatter/
EXPLAIN: Background Knowledge • Characteristics that help to identify or classify matter are called properties. All matter has both physical properties and chemical properties.
Physical propertiescan be seen without changing the identity of the matter. *Below is a list of some common physical properties of matter.
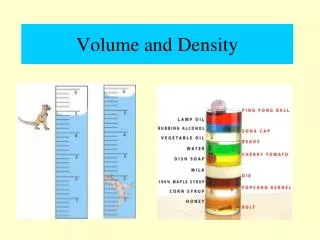
Density • Density is the physical property that will be learned in this lab. It is a characteristic of matter that is constant and never changes. • Densityis a measure of the amount of matter in a certain amount of space.
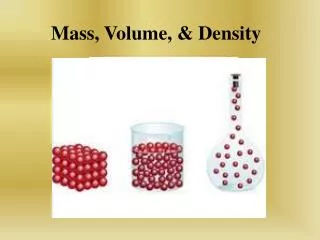
Look at this illustration of density: • The cubes are both the same size. However, the cube on the left has more particles in it than the cube on the right. This means that the cube on the left has a higher density than the cube on the right because there are more particles in the same amount of space.
Calculating Density Density may be calculated if the mass and volume of a material is determined by dividing the mass by the volume. (D = m ÷ V)
Objective: The student will apply the scientific process to problem solve by observing, recording, analyzing, and communicating results to compare and measure density.
Purpose: To apply the scientific process to problem solve by observing, recording, analyzing, and communicating results to compare and measure density.
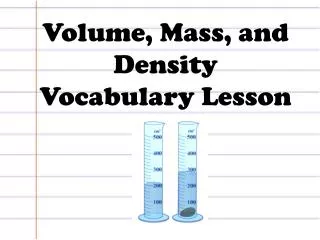
Materials: • 50 mL of red liquid in a bottle • 50 mL of blue liquid in a bottle • 50 mL of green liquid in a bottle • Graduated cylinder • Calculator • Triple-beam balance or scale • 3 different colors of pencils or crayons
Hypothesis (write in your own as an IF…..THEN…. statement) If we find the mass and volume of 3 different liquids, then we will _____________________________________.
Procedures EXPLORE • On the triple-beam balance, calculate the mass of the empty graduated cylinder and record this mass in the data collected section of the experiment. • Pour 10 mL of the red liquid into the graduated cylinder. Be sure to bring your “eye” down to the level of the liquid and read the bottom of the meniscus. • Determine the mass and record the mass after subtracting the mass of the graduated cylinder.
Procedures 4. Calculate the density of the liquid by dividing the mass by the volume. 5. Add another 10 mL to the cylinder (there is now a total of 20 mL of red liquid). • Determine the mass and record the mass minus the mass of the graduated cylinder.
Procedures 7. Find the density again by dividing the mass by 20 mL and record it on the Data Table. 8. Keep adding 10 mL of the red liquid, recording the mass and calculating the density until a total of 50 mL of the red liquid has been used. 9. Return the liquid to the bottle. 10. Repeat the procedure for each of the other liquids, finding mass and density.
Collecting Data • Data is the information gathered during an experiment. Sometimes data involve counting or measurements such as length. • Data that involves numbers or measurements should be organized in a table. Once the data has been collected from the experiment, it must be analyzed, or a decision about what the data means is drawn.
Graphing • Sometimes calculations need to be completed. In addition, a graph may need to be compiled. A graph helps people to understand the data and gives viewers a picture of the data. A conclusion about what was learned from the experiment can then be drawn from the analyzed data.
Graph the mass on the y-axis (up the side) and the volume on the x-axis (across the bottom) for each liquid on the graph paper to the right of the table. Use a different color for each of the liquid solutions.
Conclusion A conclusion is an explanation based on evidence from observations. It answers, “Does the data support the hypothesis?”
Conclusion 1. As the mass increases, what happens to the volume of each sample?__________________________________________________________ 2. Examine your density calculations for the red liquid. Should the density be the same in each instance? Explain your answer. _______________________________________________________________________
Conclusion 3. If an object floats in water, what can you tell about its density? ________________________________________________________________________________________________What if it sinks? __________________________________________________________
Communicating Results Now your results need to be communicated to others. This allows you to evaluate and understand the experiment. It also allows others to duplicate the experiment to see if any mistakes were made in the experiment itself, the calculations, or analysis.
ELABORATE How do your results compare to those of your classmates? Share and discuss.
EVALUATE The density of water is 1.0 g/cm3. An object that has a density less than the density of water will float. Which of the following materials will float in water? A. gold: density of 19.3 g/cm3 B. corn oil: density of 0.9 g/cm3 C. aluminum: density of 2.7 g/cm3 D. steel: density of 7.8 g/cm3
Gizmos www.explorelearning.com
Science Capacity Development Team Cristian Carranza, Science Manager cristian.carranza@palmbeach.k12.fl.us