Download
1 / 20
200 likes | 320 Views
A Panoramic View of 3G Data/Control-Plane Traffic: Mobile Device Perspective. Xiuqiang He 1 , Patrick P. C. Lee 2 , Lujia Pan 1 , Cheng He 1 and John C. S. Lui 2 1 Noah’s Ark Lab, Huawei Research, China 2 The Chinese University of Hong Kong, Hong Kong. Motivation.

E N D
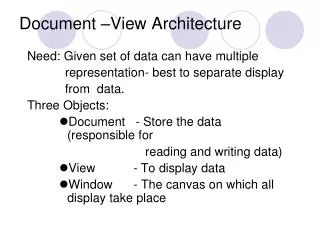
A Panoramic View of 3G Data/Control-Plane Traffic: Mobile Device Perspective Xiuqiang He1, Patrick P. C. Lee2, Lujia Pan1, Cheng He1 and John C. S. Lui2 1Noah’s Ark Lab, Huawei Research, China2The Chinese University of Hong Kong, Hong Kong
Motivation Smart phone shipments forecast In million units • Smartphones, tablet computers, and datacard attached to laptops/PCs increase rapidly • tremendous growth of mobile Internet access worldwide • bring great challenges to the data/control plane of 3G/4G network 1.2billion <<Source: IDC, 2012>> • Questions: • What are the traffic patterns of different device types? • How traffic patterns of different device types influence the performance of cellular data networks in both data/control plane?
Server Internet 3G UMTS Network • We collected data/control-plane traffic from a commercial 3G UMTS network deployed in a metropolitan city in China. Iu SGSN RNC IPBearer R R Switch router router GGSN Gn RNC SGSN Gi data/control plane traffic Iub RRC record logs Data summary
Related work • Measurement studies of 3G network • Round-trip times of TCP flow data (GPRS/UMTS network) [Kilpi_Networking2006] • Compare similarity and difference with wireline data traffic (CDMA2000) [Ridoux_INFOCOMM2006] • TCP performance and traffic anomalies (GPRS/UMTS network) [Ricciato_CoNext2005] [Alconze_Globecom2009] • Control-plane performance of 3G network • Signaling overhead from security perspective [Lee_computernetworks2009] • Infer RRC state transition from data-plane traffic[Qian_IMC2010]
Related work • Data traffic behavior of different types of devices • Compare handheld and non-handheld devices in campus WiFi network [Gember_PAM2011] • Study smart phone traffic and differences of user behaviors based traces of individual devices [Falaki_IMC2010] • 3GTest, a tool generate probe traffic to measure the 3G network performance [Huang_MobiSys2011]
Our Work • Contributions: • Propose a methodology of correlating data- and control-plane traces based on 3G standards • Conduct extensive measurement study on 24 hours of data/control-plane traces • ~60K devices, ~1.9TB of data Characterize both data- and control-plane performance and their interactions of different device types in a 3G cellular network in China
Workflow • Extracting signaling messages • Performance • 1. Over 90% of the traffic can be identified by DPI • Over 99% of the devices can be identified Raw data preprocessing … • DPI module from a commercial product DPI Analysis • Identify the data/control traffic for each RRC connection Data-Signaling Correlation All steps are implemented as Map-Reduce programs and run on a Hadoop platform In-Depth Analysis
RRC Connection Setup RNC CN UE RRC connection setup RANAP: Initial UE message SCCP CC (Success/Failure) RANAP: Common ID (IMSI) RAB Assignment Request RAB Setup RAB Assignment Response SCCP CC Common ID RAB Assignment request RAB Assignment response
Data-Signaling Correlation SCCP CC Within 15 seconds Common ID RAB Assignment request RAB Assignment response Signaling packets Within 150 seconds Within 150 seconds RRC logs Data plane packet IMEI Library Correlation results
Applications/Terminals • Applications • Web browsing, Streaming, File Access, Instant • Messaging (IM), Email, P2P, • Network Admin, Tunneling, and others. • Device types • iPhone, Android, Symbian, Windows Phone • Black Berry, Bada, Linux, iPad, Datacard • Feature Phone
Overview Focus on the 1-day traces on Nov. 28, 2010
Device Distributions No. of devices for each terminal type • iPhone leads all devices with a portion of 32%, and Symbian 23%, Feature phone 15%, Android 8%, windows phone 5%, datacard 8% Total traffic volume of each device type • Datacard contributes 46% of the total traffic, iPhone 23%, iPad 12%, Android 4%, Windows phone 2%
Control-Plane Performance Average number of RRC connections per device • iPhone triggers the most RRC connections of 237 times, iPad 174, Android 167, Windows Phone 126, and datacard only 68 . • iPhone brings large signaling overhead of an RNC • iPhone has the smallest duration 30 seconds, Windows Phone 31, Android 26, and datacard with the longest duration of 230. Average RRC Duration per device
Applications Overview Traffic volume of applications • Web browsing 38%, streaming 21%, P2P 10%, and file access 10% are ranked top four most used applications • IM contributes 2% of the total traffic • Tunneling triggers the most RRC connections (43%), • IM triggers 21% of all connections • P2P triggers only 0.1% of all RRC connections Total number of RRC connections of applications
Applications on terminals • Datacard contributes 85% and 48% of all P2P and streaming traffic • Web browsing, streaming and file access are the top 3 applications that accounts for the most traffic on smartphones.
Active devices Traffic volume (per minute) dist. No. of active devices (per minute) 52%↓ 93%↓ • The number of active devices of iPhone and iPad remain stable during the 24-hour period, distinct from other devices which have obvious peak-trough pattern. • Possible reason: Internal heartbeat mechanism of iPhone and iPad.
Heartbeat Mechanism • PDF of inter-arrival times of RRC connections iPhone Android • The inter-arrival times of RRC connections of iPhone occur more often at 60 seconds (18.1%) and 589 seconds (5%), similar for iPad. • iOS device generates heartbeat packets every 60 seconds and triggers an RRC connection. • No explicit heartbeat patterns in Android
Summary • Datacard devices contribute almost 50% of the total traffic, accounting for only 7% of the device population. • iPhone/iPadaccount for around 40% of the devices, and contribute nearly 40% of the total traffic due to their large market shares. • Web browsing, streaming and file access are the mostly used applications on smart phones, and they together contribute more than 90% of iPhone/iPad traffic. • IM contributes only 2% of the traffic, but triggers over 21% of the RRC connections (signaling resource) • iPhone/iPad triggers significantly more RRC connections than any other device type, and increase signaling overhead to the network
Future work • Limitations of our work: • Our dataset was collected nearly 1.5 years ago. There is dramatic growth of data/control-plane traffic. • There are regular version updates for smartphone OS. Data transmission behavior may have changed. • Future work: • Validate our findings for latest dataset • Our methodology remains applicable for today’s 3G networks
Q&A • Thanks for your time