Download
1 / 13
130 likes | 577 Views
Shifting the Lorenz Curve. 1,000 people earn $150,000 9,000 people earn $10,000 The top 10% earns 15 times as much as the lower 90% Government costs $10,000,000 to run. An Example. 1,000 people earn $150,000 9,000 people earn $10,000 The top 10% earns 15 times as much as the lower 90%

E N D
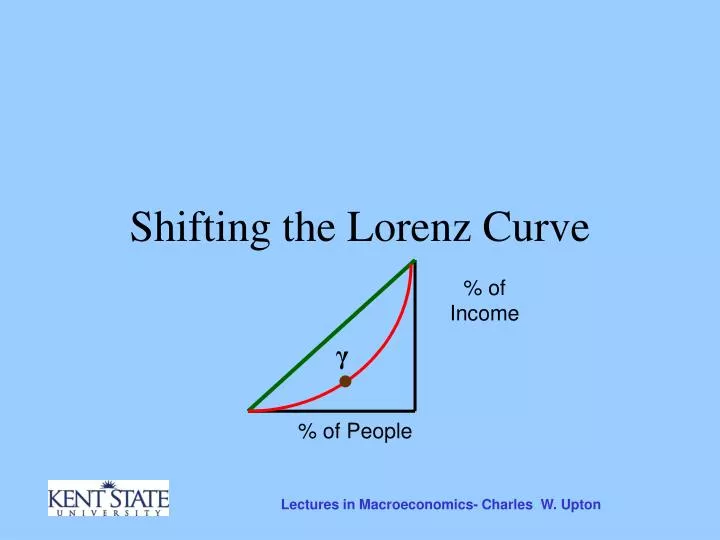
Shifting the Lorenz Curve Lectures in Macroeconomics- Charles W. Upton
1,000 people earn $150,000 9,000 people earn $10,000 The top 10% earns 15 times as much as the lower 90% Government costs $10,000,000 to run An Example Shifting the Lorenz Curve
1,000 people earn $150,000 9,000 people earn $10,000 The top 10% earns 15 times as much as the lower 90% Government costs $10,000,000 to run Impose the entire tax burden on the top 1,000. An Example Shifting the Lorenz Curve
1,000 people earn $150,000 9,000 people earn $10,000 The top 10% earns 15 times as much as the lower 90% Government costs $10,000,000 to run Impose the entire tax burden on the top 1,000. Their earnings drop to $140,000 and the ratio is 14:1. An Example Shifting the Lorenz Curve
1,000 people earn $150,000 9,000 people earn $10,000 The top 10% earns 15 times as much as the lower 90% Government costs $10,000,000 to run Tax the top 1,000 $100,000 each, & give everyone $9,000. Going with the Flow Shifting the Lorenz Curve
1,000 people earn $150,000 9,000 people earn $10,000 The top 10% earns 15 times as much as the lower 90% Government costs $10,000,000 to run The top 10% now earns $150,000 - $100,000 + $9,000 = $59,000 The bottom 90% now earns $10,000 + $9,000 = $19,000 An Example Shifting the Lorenz Curve
1,000 people earn $150,000 9,000 people earn $10,000 The top 10% earns 15 times as much as the lower 90% Government costs $10,000,000 to run The income ratio is 3:1 (Actually 59:19) An Example Shifting the Lorenz Curve
The Lorenz Curve % of Income % of People Shifting the Lorenz Curve
The Lorenz Curve % of Income % of People Shifting the Lorenz Curve
The Lorenz Curve % of Income γ % of People Shifting the Lorenz Curve
The Gini Coefficient γ is normalized to lie between zero and one. γ = 0 means uniform income distribution; γ = 1 means one guy has it all. % of Income γ % of People Shifting the Lorenz Curve
The Gini Coefficient over Time Lots of studies of how γ has changed over time and how US tax system impacts it. % of Income γ Few Answers. % of People Shifting the Lorenz Curve
End ©2004 Charles W. Upton. All rights reserved Shifting the Lorenz Curve