Download
1 / 19
200 likes | 425 Views
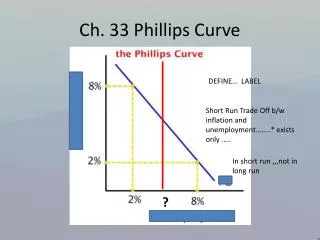
The Phillips Curve. Understanding the Relationship Between Inflation and Unemployment. The Phillips Curve-Understanding the Relationship Between Inflation and Unemployment. An inverse relationship between inflation and unemployment until the 1970s 1970s high inflation and unemployment

E N D
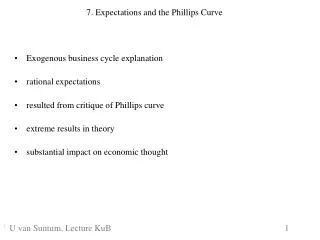
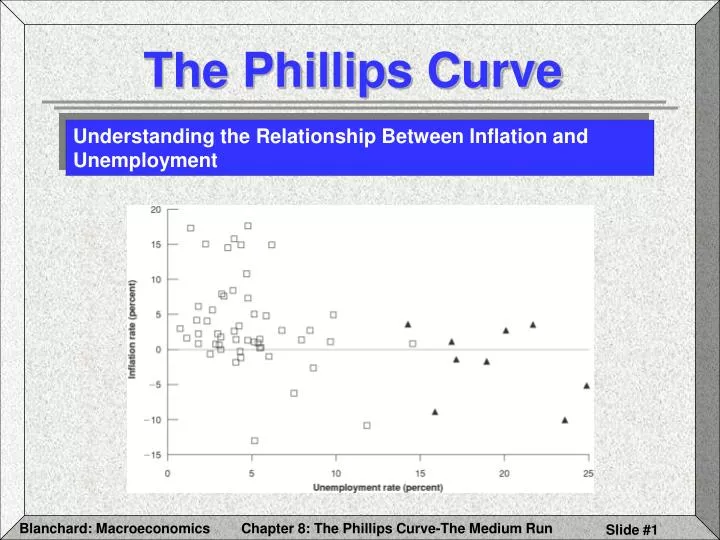
The Phillips Curve Understanding the Relationship Between Inflation and Unemployment
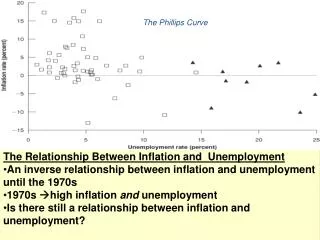
The Phillips Curve-Understanding the Relationship Between Inflation and Unemployment • An inverse relationship between inflation and unemployment until the 1970s • 1970s high inflation and unemployment • Is there still a relationship between inflation and unemployment?
The Phillips Curve – Understanding Inflation, Expected Inflation, and Unemployment From our wage setting – price setting model: Wt = PteF(ut,z) and Pt = (1+µ) Wt Lets assume that F(ut,z) = 1-ut+z Then Pt = Pte(1+µ)F(ut,z) Pt = Pte(1+µ) (1-ut+z)
The Phillips Curve – Understanding Inflation, Expected Inflation, and Unemployment From Pt = Pte(1+µ) (1-ut+z) We can derive t = t e + (µ+z)-ut where t = the inflation rate t e = the expected inflation rate
The Phillips Curve – Understanding Inflation, Expected Inflation, and Unemployment Observations: t = t e + (µ+z) - ut • Higher expected inflation leads to higher inflation • Given expected inflation, the higher the µ or z, the higher inflation • Given expected inflation, the higher unemployment, the lower inflation
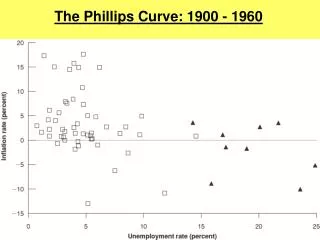
The Phillips Curve – Understanding Inflation, Expected Inflation, and Unemployment The Early Incarnation, Circa 1960 • Average inflation close to zero • t e = O • t = (µ+z) - ut • Low unemployment leads to high wage increases leads to high price increases leads to high wage increases in a wage – price spiral.
The Phillips Curve – Understanding Inflation, Expected Inflation, and Unemployment The Early Incarnation, Circa 1960
1970s: Why did the Phillips curve vanish?higher oil prices increased µandinflation became persistent andpositive
The Phillips Curve – Understanding Inflation, Expected Inflation, and Unemployment Inflation & Expectations
Assume: The Phillips Curve – Understanding Inflation, Expected Inflation, and Unemployment Inflation & Expectations • the effect of last year’s inflation rate on this year’s expected inflation rate • the higher the value of , the higher the expected inflation rate
The Phillips Curve – Understanding Inflation, Expected Inflation, and Unemployment Mutations & Expectations • 1900-1960: Inflation low and not persistent • = 0, te = t-1 = 0 and • t= (µ+z) – ut (the normal Phillips Curve)
The Phillips Curve – Understanding Inflation, Expected Inflation, and Unemployment Mutations & Expectations • 1970s: Inflation high and persistent • started to increase to 1 • t= t-1 + (µ+z) – ut ( t-1 = te ) • The inflation rate depends on: • The unemployment rate (ut) • Last year’s inflation rate ( t-1)
The Phillips Curve – Understanding Inflation, Expected Inflation, and Unemployment Inflation & Expectations When: t= t-1 + (µ+z) – ut and = 1 Aggregate supply = t – t-1 = (µ+z) – ut Therefore: The unemployment rate affects the change in the inflation rate High unemployment decreases inflation the inflation rate
Inflation & Expectations 1970-1998: t – t-1 = 6.5% – 1.0ut
The Phillips Curve – Back to the Natural Rateof Unemployment At the natural rate of unemployment (un): The actual inflation rate = expected inflation ratet = te • Given: t – te + (µ+z) – un • Then: 0 = (µ+z) – un
Given: The Nonaccelerating Inflation Rate of Unemployment (NAIRU) Then: un = µ + z Given: t = te + (µ+z) – ut Then: t = te + un – ut t – te = -(ut – un) ut – un t =te
The Phillips Curve – A Summary and Many Warnings Summary: The AS relation: t – t-1 = -(ut – un) shows that: Inflation increases when ut > un Inflation decreases when ut < unHowever: the relation can shift
m + µ and z are assumed consistent t = u n L The Phillips Curve – Differences in the Natural Rate Across Countries • Changes in u and z • The composition of the labor force • The structure of wage bargaining • Unemployment benefits • Can you think of others?
The Phillips Curve – Differences in the Natural Rate Across Countries The Limits of Our Understanding Europe in the 1990s