Download
1 / 1
10 likes | 139 Views
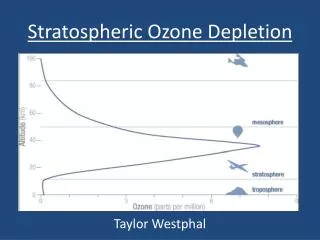
60. Initial guess/prior TES retrieval TES error range. Initial guess TES retrieval Sonde Sonde with TES op. 30. 0. Version 002 R2971 Seq0100 Scn003 Hohenpeissenberg (48N, 11W) 2005-07-18.

E N D
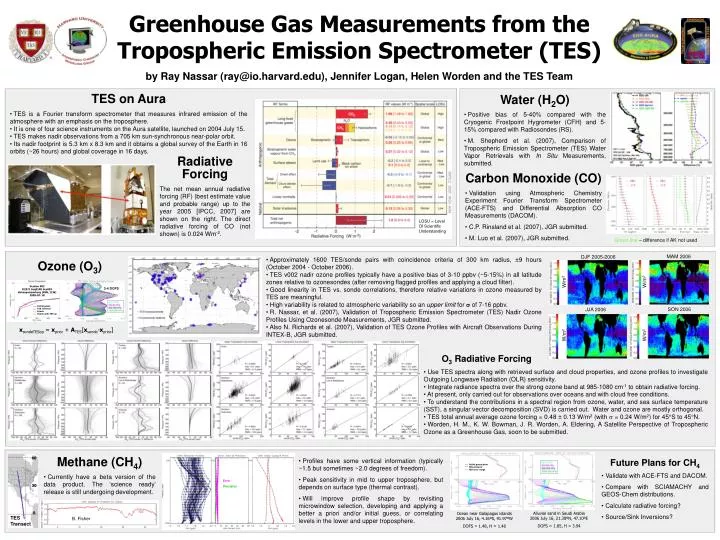
60 Initial guess/prior TES retrieval TES error range Initial guess TES retrieval Sonde Sonde with TES op 30 0 Version 002 R2971 Seq0100 Scn003 Hohenpeissenberg (48N, 11W) 2005-07-18 Greenhouse Gas Measurements from the Tropospheric Emission Spectrometer (TES)by Ray Nassar (ray@io.harvard.edu), Jennifer Logan, Helen Worden and the TES Team • TES on Aura • TES is a Fourier transform spectrometer that measures infrared emission of the atmosphere with an emphasis on the troposphere. • It is one of four science instruments on the Aura satellite, launched on 2004 July 15. • TES makes nadir observations from a 705 km sun-synchronous near-polar orbit. • Its nadir footprint is 5.3 km x 8.3 km and it obtains a global survey of the Earth in 16 orbits (~26 hours) and global coverage in 16 days. • Water (H2O) • Positive bias of 5-40% compared with the Cryogenic Frostpoint Hygrometer (CFH) and 5-15% compared with Radiosondes (RS). • M. Shepherd et al. (2007), Comparison of Tropospheric Emission Spectrometer (TES) Water Vapor Retrievals with In Situ Measurements, submitted. Radiative Forcing The net mean annual radiative forcing (RF) (best estimate value and probable range) up to the year 2005 [IPCC, 2007] are shown on the right. The direct radiative forcing of CO (not shown) is 0.024 Wm-2. • Carbon Monoxide (CO) • Validation using Atmospheric Chemistry Experiment Fourier Transform Spectrometer (ACE-FTS) and Differential Absorption CO Measurements (DACOM). • C.P. Rinsland et al. (2007), JGR submitted. • M. Luo et al. (2007), JGR submitted. LOSU = Level Of Scientific Understanding Green line – difference if AK not used MAM 2006 DJF 2005-2006 • Approximately 1600 TES/sonde pairs with coincidence criteria of 300 km radius, ±9 hours (October 2004 - October 2006). • TES v002 nadir ozone profiles typically have a positive bias of 3-10 ppbv (~5-15%) in all latitude zones relative to ozonesondes (after removing flagged profiles and applying a cloud filter). • Good linearity in TES vs. sonde correlations, therefore relative variations in ozone measured by TES are meaningful. • High variability is related to atmospheric variability so an upper limit for s of 7-16 ppbv. • R. Nassar, et al. (2007), Validation of Tropospheric Emission Spectrometer (TES) Nadir Ozone Profiles Using Ozonesonde Measurements, JGR submitted. • Also N. Richards et al. (2007), Validation of TES Ozone Profiles with Aircraft Observations During INTEX-B, JGR submitted. Ozone (O3) W/m2 W/m2 3-4 DOFS SON 2006 JJA 2006 xsondeTESop = xprior + ATES[xsonde-xprior] W/m2 W/m2 • O3 Radiative Forcing • Use TES spectra along with retrieved surface and cloud properties, and ozone profiles to investigate Outgoing Longwave Radiation (OLR) sensitivity. • Integrate radiance spectra over the strong ozone band at 985-1080 cm-1 to obtain radiative forcing. • At present, only carried out for observations over oceans and with cloud free conditions. • To understand the contributions in a spectral region from ozone, water, and sea surface temperature (SST), a singular vector decomposition (SVD) is carried out. Water and ozone are mostly orthogonal. • TES total annual average ozone forcing = 0.48 ± 0.13 W/m2 (with s = 0.24 W/m2) for 45°S to 45°N. • Worden, H. M., K. W. Bowman, J. R. Worden, A. Eldering, A Satellite Perspective of Tropospheric Ozone as a Greenhouse Gas, soon to be submitted. • Methane (CH4) • Currently have a beta version of the data product. The ‘science ready’ release is still undergoing development. • Profiles have some vertical information (typically ~1.5 but sometimes ~2.0 degrees of freedom). • Peak sensitivity in mid to upper troposphere, but depends on surface type (thermal contrast). • Will improve profile shape by revisiting microwindow selection, developing and applying a better a priori and/or initial guess, or correlating levels in the lower and upper troposphere. • Future Plans for CH4 • Validate with ACE-FTS and DACOM. • Compare with SCIAMACHY and GEOS-Chem distributions. • Calculate radiative forcing? • Source/Sink Inversions? Error Precision Alluvial sand in Saudi Arabia 2006 July 16, 21.38ºN, 47.10ºE DOFS = 1.85, H = 3.94 Ocean near Galapagos islands 2006 July 16, 4.16ºS, 91.97ºW DOFS = 1.48, H = 1.46 TES Transect B. Fisher