Download
1 / 46
460 likes | 476 Views
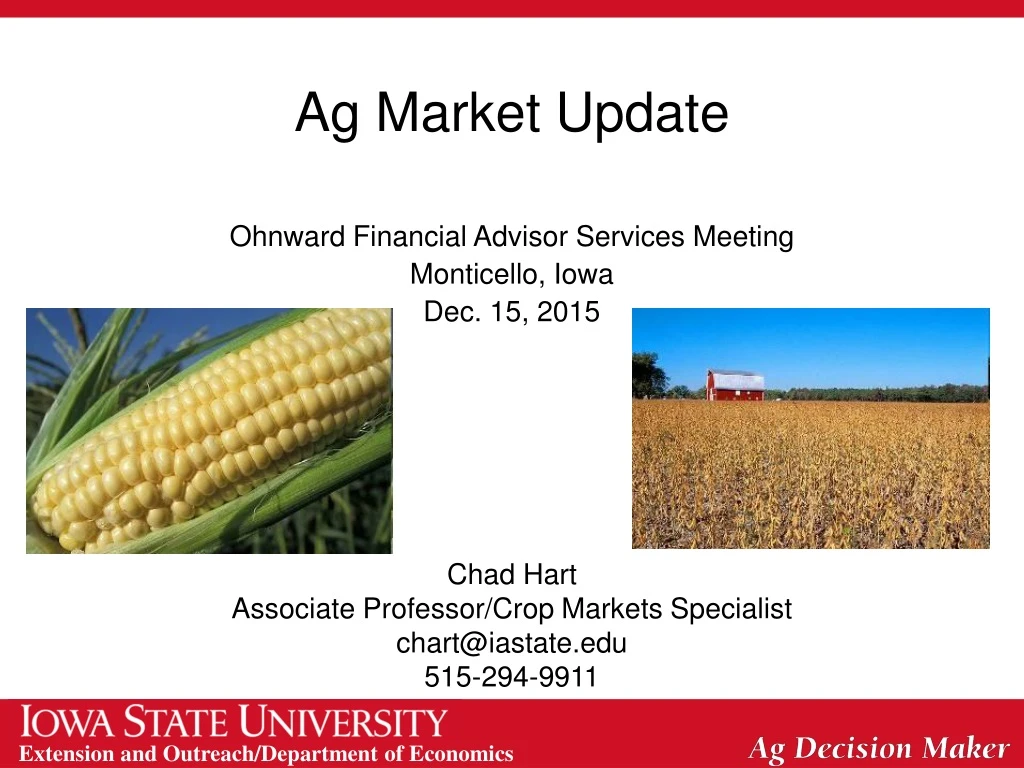
Ag Market Update. Ohnward Financial Advisor Services Meeting Monticello, Iowa Dec. 15, 2015 Chad Hart Associate Professor/Crop Markets Specialist chart@iastate.edu 515-294-9911. Key factors for 2015/16 and beyond. Feedstuffs – ADVANTAGEOUS for livestock sector

E N D
Ag Market Update Ohnward Financial Advisor Services Meeting Monticello, Iowa Dec. 15, 2015 Chad Hart Associate Professor/Crop Markets Specialist chart@iastate.edu 515-294-9911
Key factors for 2015/16 and beyond • Feedstuffs – ADVANTAGEOUS for livestock sector • Size of hog industry driven by last year’s profitability – Productivity to guide 2016 supply prospects • Tight cattle-beef supplies but expansion well underway – Supply of heavy cattle has driven market lately • HPAI in U.S. poultry – HUGE hit on layers/eggs, only meat impact was turkey, broilers were okay – Rebuild/expansion underway • Relatively stable domestic dairy herd expected through 2017 – Worldwide production up, prices • U.S. consumer demand has been GOOD – International trade a bit of a drag but should improve
Hog Crush Margin The Crush Margin is the return after the pig, corn and soybean meal costs. Carcass weight: 200 pounds Pig price: 50% of 5 mth out lean hog futures Corn: 10 bushels per pig Soybean meal: 150 pounds per pig Source: ISU Extension
2013 = +$4.77 [-$14.80 to +$22.07] 2014 = +$39.48 [+$1.62 to +$84.64] 2015* = -$14.20 [-$30.45 to +$4.70] 2016* = -$6.29 [-$16.39 to +$12.26]
New Pork Packing Plants (2017) Sioux City, IA ― Seaboard/Triumph Coldwater, MI ― Clements Foods Data Source: USDA/AMS. * Steve Meyer, Vice President, Pork Analysis, Express Markets Inc. Analytics.
U.S. Pork Exports, Jan-Oct 2015 (Volume excluding by-products & variety meats) WASDE U.S.: 2014: 4,857 mil lbs 2015: 4,946 (+1.8% vs 2014) 2016: 5,125 (+3.6% vs 2015) Source: USDA/ERS
LMIC Pork Production and Price Quarterly Forecasts (12/10/15) Sources: USDA/NASS; USDA/AMS Livestock Market News; Projections and Forecasts by LMIC
LMIC Pork Production and Price Quarterly Forecasts (12/10/15) Sources: USDA/NASS; USDA/AMS Livestock Market News; Projections and Forecasts by LMIC
Broad 2015/16 Profitability Situation & Outlook • Industry at tipping point on role of tight supplies • Cow-calf: Good (but not 2014) • Backgrounding: Discouraging, VOG estimates low and volatile • Feedlot: Struggle, with lots of $ tied up
Cattle Crush Margin The Crush Margin is the return after the feeder steer and corn costs. Live weight: 1250 pounds Feeder weight: 750 pounds Corn: 50 bushels per head Source: ISU Extension
Data Source: USDA & LMIC, Compiled by LMIC Livestock Marketing Information Center
Cattle on Feed―11/20 report • (1,000+ head capacity feedlots) • Nov .1 On Feed: +2.1% • Vs. +2.2% pre-report est. (+1.6%, +3.2%) • IA: +8.5% vs last year [1,000+ Head] • IA: +6.3% vs last year [<1,000 Head] • Oct. Placements: -3.7% • Vs. -3.9% pre-report est. (-6.2%, -1.6%) • IA: +18.2% vs last year; largest (+) of main states [1,000+ Head] • IA: +9.3% vs last year [<1,000 Head] • Oct. Marketings: -3.3% • Vs. -3.9% pre-report est. (-5.0%, -2.0%) • IA: +13.0% vs last year (TX -14%, KS -6%, SD -9%, MN +45%) [1,000+ Head] • IA: +28.8% vs last year [<1,000 Head]
Data Source: USDA-AMS & USDA-NASS Livestock Marketing Information Center
Data Source: USDA-AMS & USDA-NASS Livestock Marketing Information Center
Data Source: USDA-AMS Livestock Marketing Information Center
U.S. Beef Exports, Jan-Oct 2015 (Volume excluding by-products & variety meats) WASDE U.S.: 2014: 2,573 mil lbs 2015: 2,223 (-13.6%) 2016: 2,425 (+9.1%) Source: USDA/ERS
U.S. Beef Imports, Jan-Oct 2015 (Volume excluding by-products & variety meats) WASDE U.S.: 2014: 2,947 mil lbs 2015: 3,382 (+14.8%) 2016: 2,945 (-12.9%) Source: USDA/ERS
U.S. Corn Supply and Use Source: USDA-WAOB
U.S. Soybean Supply and Use Source: USDA-WAOB
Cattle Crush Margin The Crush Margin is the return after the feeder steer and corn costs. Live weight: 1250 pounds Feeder weight: 750 pounds Corn: 50 bushels per head Source: ISU Extension
U.S. Meat Production & Prices Source: USDA-WAOB
Corn Export Sales Source: USDA-FAS
Soybean Export Sales Source: USDA-FAS
Strength of the U.S. Dollar Source: Federal Reserve
Crude Oil Prices Sources: EIA and CME
Current Corn Futures 3.78 3.61 Source: CME Group, 12/14/2015
Current Soybean Futures 8.55 8.48 Source: CME Group, 12/14/2015
Iowa Corn Costs Overall 75% increase 88% 26% 88% 46% Source: AgDM A1-21
Iowa Soybean Costs Overall 69% increase 88% 14% 56% 72% Source: AgDM A1-21
Thank you for your time!Any questions?My web site:http://www2.econ.iastate.edu/faculty/hart/Iowa Farm Outlook:http://www2.econ.iastate.edu/ifo/Ag Decision Maker:http://www.extension.iastate.edu/agdm/