Download
1 / 12
120 likes | 266 Views
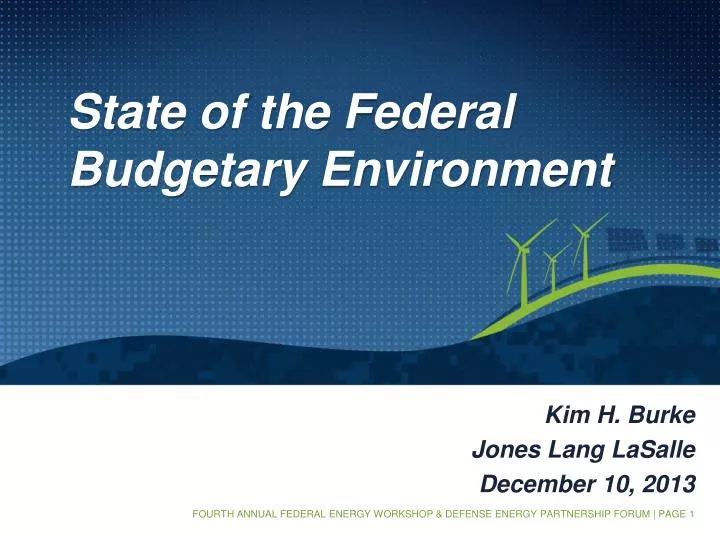
State of the Federal Budgetary Environment. Kim H. Burke Jones Lang LaSalle December 10, 2013. Federal Spending Has Nearly Doubled Since 2001. Total Federal Spending ($Trillions). 2013 Federal Spending Breakdown: All Other Activities: 33% Social Security: 22% Defense: 18% Medicare: 14%

E N D
State of the Federal Budgetary Environment Kim H. Burke Jones Lang LaSalle December 10, 2013
Federal Spending Has Nearly Doubled Since 2001 Total Federal Spending ($Trillions) • 2013 Federal Spending Breakdown: • All Other Activities: 33% • Social Security: 22% • Defense: 18% • Medicare: 14% • Medicaid: 7% • Interest: 6% Source: CATO Institute
How Spending is Allocated Has Also Changed Source: Bipartisan Policy Center
Budget Impasse Has America Living on the Edge Haven’t gone over the fiscal cliff... …but not yet out of the woods either!
Consolidation Budget Chaos through the Eyes of a Federal Employee No-Net-New DoD/Civilian BRAC(?) Fiscal Cliff Continuing Resolutions Budget Battles Sequestration Space Reduction Fiscal Cliff Debt Ceiling
Budget Gridlock Shutdown GDP grew 3.6% in 3Q13 but 16-day shutdown may slow growth at a rate more harmful than initially estimated • Initial Estimates – At least $300M/day ($4.8B over 16 days) in lost economic output, with daily impact predicted to accelerate due to depressed business/consumer confidence and spending (Source: IHS) • Final Estimates – Removed $24B ($1.5B/day) from U.S. economy and reduced projected 4Q13 GDP growth from 3.0% to 2.4% (Source: S&P) • Post-Mortem – 6.6M days of lost work, $2B in back-pay costs, and 120K lost private-sector jobs (Source: Obama Administration)
Sequestration’s Impact Across Federal Government Total Projected Savings from Sequester: $1.2T (2013-2021) Savings from Spending Cuts: $984B($109B/year for 9 Years) Assumed Debt Service Savings: $216B 2014 Sequestration Cuts Hit Defense and Non-Defense Equally Sequester Savings Breakdown (2013-2021, in $B) Source: Bipartisan Policy Center
Sequestration’s Impact to DoD Sequestration’s full impact not yet felt due to timing of when appropriation cuts occur and when funds are actually spent (i.e., outlays)—and more pain may be on the way Because of the structure of defense spending, our national security forces and defense industry have been able to continue operating under sequestration, but not without permanent damage. The full brunt of the cuts hasn’t hit yet, and if we go down the sequester path for too long, we won’t be able to reverse the devastating impacts. —“Merely Stupid to Dangerous: The Sequester’s Effects on National and Economic Security” (Bipartisan Policy Center) Source: Bipartisan Policy Center
Approach to the New Reality REMAINING FUNDING SHORTFALL DECREASE FUNDING SHORTFALL PROJECTED FUNDING SHORTFALL COST CUTTING REMAINING FUNDING SHORTFALL Increase Available Funding (or Services In-Kind) DECREASE FUNDING GAP ALTERNATIVE FINANCING • ESPC • EUL • PPA • UESC
OMB and CBO Positions on Alternative Financing • CBO Position on VA Leases – Scored as capital leases, requiring up-front funding for the full lease term and resulting in the delay of 27 leases in FY 2013-2014 (24 clinical) • OMB and ESPCs – Memo from Jack Lew (July 25, 1998) classified all budget authority and outlays associated with ESPCs as discretionary and recognized on annual basis • CBO and ESPCs – Treats contract as “direct” (mandatory) spending but net savings in energy costs as a potential reduction in discretionary spending • Savings are not fully captured as most are expected to occur beyond the five- and ten-year estimating windows covered by CBO’s cost estimates
Other Opportunities for Energy Reduction and Cost Savings GSA Headquarters Space Before Renovation Scale of Federal portfolio presents tremendous opportunity to reduce resource consumption and CO2 emissions, increase tenant-agency satisfaction and decrease operating expenses • More than 42K federally owned and leased assets categorized as office space in 2011—encompassing nearly 800M SF in space • Two-thirds held or leased by civilian agencies • One-third held or leased by DoD and military departments Strategies for achieving greater energy and cost savings: • Consolidations, co-locations, dispositions • Portfolio right-sizing / optimization of existing space (reconfigurations) • Workplace strategies (telework, hoteling, etc.) to reduce demand for space and energy resources GSA Headquarters Space After Renovation Source for Photos and Portfolio Metrics: GAO Report 14-41: Federal Real Property – Selected Agencies Plan to Use Workforce Mobility to Reduce Space, but Most Efforts are Too New to Have Realized Savings (October 2013)
Contact Kim H. Burke Managing Director, Public InstitutionsJones Lang LaSalle(202) 719-5613 kim.burke@am.jll.com