Download

1 / 69
700 likes | 820 Views
Market Equilibrium. Module 4. 1. Define a market equilibrium , and use a demand-supply graph to represent a market equilibrium. Objectives. 2. Define a market equilibrium , and use a demand-supply graph to represent a market equilibrium.

E N D
Market Equilibrium Module 4 1
Define a market equilibrium, and use a demand-supply graph to represent a market equilibrium. Objectives 2
Define a market equilibrium, and use a demand-supply graph to represent a market equilibrium. Understand what is a shortage, how to calculate the amount of shortage, and how to eliminate a shortage in a free market. Objectives 3
Define a market equilibrium, and use a demand-supply graph to represent a market equilibrium. Understand what is a shortage, how to calculate the amount of shortage, and how to eliminate a shortage in a free market. Understand what is a surplus, how to calculate the amount of surplus, and how to eliminate a surplus in a free market. Objectives 4
Define a market equilibrium, anduse a demand-supply graph to represent a market equilibrium. Understand what is a shortage, how to calculate the amount of shortage, and how to eliminate a shortage in a free market. Understand what is a surplus, how to calculate the amount of surplus, and how to eliminate a surplus in a free market. Analyze changes in equilibrium using a demand-supply graph. Objectives 5
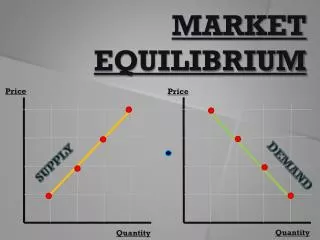
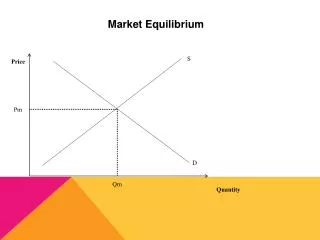
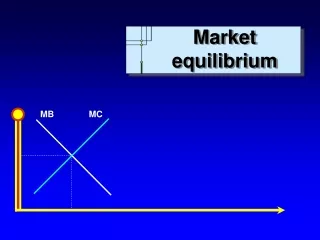
Objective 1 Define a market equilibrium, use a demand-supply graph to represent a market equilibrium • A market is represented by both demand and supply curves to capture the fact that buyers and sellers interact in a market. 6
Objective 1 Define a market equilibrium ... Quantity demanded equals quantity supplied • A market equilibrium is a situation where quantity demanded equal quantity supplied.
Objective 1: … market equilibrium Market Demand and Supply Schedule Coffee Market Demand and Supply Graph
Objective 1: … market equilibrium Market Demand and Supply Schedule • In an equilibrium there are no shortagesor surpluses. 9
Objective 2 Understand what is a shortage, how to calculate the amount of a shortage…. • What happens at a price other than the equilibrium price? For example, consider a price below equilibrium, such as $1.50. At a price of $1.50, quantity demanded is 800 and quantity supplied is 200, resulting in a shortage of 600 cups.
Objective 2 Understand what is a shortage, how to calculate the amount of a shortage … At a price of $1.50, quantity demanded is 800 and quantity supplied is 200, resulting in a shortage of 600 cups. • A shortage or excess demand arises when the price is belowthe market equilibrium price.
Objective 2: … what is a shortage, how to calculate the amount of a shortage … At a price of $1.50, quantity demanded is 800 and quantity supplied is 200, resulting in a shortage of 600 cups. • A shortage or excess demand arises when the price is belowthe market equilibrium price. • It is measured by the difference betweenquantity demanded and quantity supplied at that price.
Objective 2: … how to eliminate a shortage • In a free market, price must rise to eliminate a shortage.
Objective 2: … how to eliminate a shortage • In a free market, price must rise to eliminate a shortage. • As price rises, quantity supplied increases and quantity demanded decreases (movement along the demand and supply curves). • This price adjustment continues until the shortage is eliminated and market is equilibrated at $3.
Objective 3 Understand what is a surplus, how to calculate the amount of a surplus … • What happens at a price above the equilibrium price, such as $4.00? At a price of $4.00, quantity demanded (point “b”) is 300 and quantity supplied (point “c”) is 700, resulting in surplus of 400 cups.
Objective 3 Understand what is a surplus, how to calculate the amount of a surplus … At a price of $4.00, quantity demanded is 300 and quantity supplied is 700, resulting in surplus of 400 cups. • A surplus or excess supply arises when the price is above the free market equilibrium.
Objective 3: … what is a surplus, how to calculate the amount of a surplus … At a price of $4.00, quantity demanded is 300 and quantity supplied is 700, resulting in surplus of 400 cups. • A surplus or excess supply arises when the price is above the free market equilibrium. • It is measured by the difference between quantity supplied and quantity demanded at that price.
Objective 3: … how to eliminate a surplus • In a free market, price must fallto eliminate a surplus.
Objective 3: … how to eliminate a surplus • In a free market, price must fall to eliminate a surplus. • As price falls, quantity supplied decreases and quantity demanded increases (movement along the demand and supply curves). • This price adjustment continues until the surplus is eliminated and market is equilibrated at $3.
More terminology … • A shortage is also called an excess demand. • A surplus is also called an excess supply.
Quantity traded … • Quantity Traded means the quantity sold or the quantity exchanged between buyers and sellers. In an equilibrium, the quantity traded equals the quantity demanded equals the quantity supplied.
Quantity traded … • When the market price is above the market equilibrium price, the quantity traded equals the quantity demanded. Quantity traded equals quantity demanded
Quantity traded … • When the market price is below the market equilibrium price, the quantity traded equals the quantity supplied. Quantity traded equals quantity supplied
Market price and quantity traded … • The market price is determined by forces of demand and supply. • Quantity traded means quantity exchanged • (between sellers and buyers) or quantity sold. • At any price there is a quantity traded as long as suppliers are willing to sell their product and buyers are willing to buy the product at that price.
Objective 4 Analyzing Changes in Equilibrium • In this segment, we will use the demand-supply model to predict what happens to equilibrium price and quantity following an economic event. • To determine what happens to equilibrium price and equilibrium quantity, we need both the demand and supply curves. 27
Objective 4 Analyzing Changes in Equilibrium • Unless stated otherwise, the analysis begins from an initialequilibrium.
Objective 4 Analyzing Changes in Equilibrium • Unless stated otherwise, the analysis begins from an initialequilibrium. • The simple 3-step process: Step 1: Determine whether the event shifts the demand curve or the supply curve or both.
Objective 4 Analyzing Changes in Equilibrium • Unless stated otherwise, the analysis begins from an initialequilibrium. • The simple 3-step process: Step 1: Determine whether the event shifts the demand curve or the supply curve or both Step 2: Determine which direction the curve shifts.
Objective 4 Analyzing Changes in Equilibrium • Unless stated otherwise, the analysis begins from an initialequilibrium. • The simple 3-step process: Step 1: Determine whether the event shifts the demand curve or the supply curve or both Step 2: Determine which direction the curve shifts. Step 3: Use the supply-and-demand diagram to see how the shift changes the equilibrium price and quantity.
Example 1: What happens to equilibrium price and quantity in the beef market if the price of corn feed falls? Objective 4: … Changes in Equilibrium 32
Example 1: What happens to equilibrium price and quantity in the beef market if the price of corn feed falls? Objective 4: … Changes in Equilibrium
Example 1: What happens to equilibrium price and quantity in the beef market if the price of corn feed falls? Objective 4: … Changes in Equilibrium • Solving the problem Step 1:Which curve shifts? A fall in the price of corn feed lowers the cost of producing beef. Hence, the supply curve shifts.
Example 1: What happens to equilibrium price and quantity in the beef market if the price of corn feed falls? Objective 4: … Changes in Equilibrium • Solving the problem Step 1:Which curve shifts? A fall in the price of corn feed lowers the cost of producing beef. Hence, the supply curve shifts. Step 2:Which direction? The supply curve shifts right. (Supply increases.)
Example 1: What happens to equilibrium price and quantity in the beef market if the price of corn feed falls? Objective 4: … Changes in Equilibrium • Solving the problem Step 1:Which curve shifts? A fall in the price of corn feed lowers the cost of producing beef. Hence, the supply curve shifts. Step 2:Which direction? The supply curve shifts right. Step 3:What happens to equilibrium price and quantity? The equilibrium price falls and the equilibrium quantity increases.
Objective 4…Changes in Equilibrium Let’s take a closer look at the adjustment process in the beef market. • At the initial price P0, following the increase in supply, there is a surplus.
Objective 4: … Changes in Equilibrium Let’s take a closer look at the adjustment process in the beef market. • At the initial price P0, following the increase in supply, there is a surplus. • It is this surplus that causes price tofall.
Objective 4: … Changes in Equilibrium Example 2:What happens in the market for Spam, an inferior good, if students’ incomes decrease? 39
Objective 4: … Changes in Equilibrium • Example 2:What happens in the market for Spam, • an inferior good, if students’ incomes decrease? • Unless stated otherwise, always begin with an initial equilibrium.
Objective 4: … Changes in Equilibrium Example 2:What happens in the market for Spam, an inferior good, if students’ incomes decrease? • Solving the problem Step 1:Which curve shifts? Income, a demand determinant, falls. Hence, the demand curve shifts.
Objective 4: … Changes in Equilibrium Example 2:What happens in the market for Spam, an inferior good, if students’ incomes decrease? • Solving the problem Step 1:Which curve shifts? Income, a demand determinant, falls. Hence, the demand curve shifts. Step 2: Which direction? Spam is an inferior good. A decrease in income leads to an increase in demand. Thus, the demand curve shifts right.
Objective 4: … Changes in Equilibrium Example 2:What happens in the market for spam, an inferior good, if students’ incomes decrease? • Solving the problem Step 1:Which curve shifts? Income, a demand determinant, falls. Hence, the demand curve shifts. Step 2: Which direction? Spam is an inferior good. A decrease in income leads to an increase in demand. Thus, the demand curve shifts right. Step 3:What happens to equilibrium price and quantity? The equilibrium price and the equilibrium quantity increase.
Objective 4: … Changes in Equilibrium Let’s take a closer look at the adjustment process in the spam market. • At the initial price P0, following the increase in demand, there is a shortage. 44
Objective 4: … Changes in Equilibrium Let’s take a closer look at the adjustment process in the spam market. • At the initial price P0, following the increase in demand, there is a shortage. • It is this shortage that causes price torise.
Objective 4: … Changes in equilibrium: both demand and supply curves shift • We will now consider the situation where both demand and supply curves shift at the same time or simultaneous shifts of the demand and supply curves. 47
Objective 4: … Changes in equilibrium: both demand and supply curves shift • There are four possible combinations of simultaneous shifts:
Objective 4: … Changes in equilibrium: both demand and supply curves shift • There are four possible combinations of simultaneous shifts: 1. Increase in both demand and supply
Objective 4….Changes in equilibrium: both demand and supply curves shift • There are four possible combinations of simultaneous shifts: 1. Increase in both demand and supply 2. Decrease in both demand and supply
Objective 4….Changes in equilibrium: both demand and supply curves shift • There are four possible combinations of simultaneous shifts: 1. Increase in both demand and supply 2. Decrease in both demand and supply 3. Increase in demand and decrease in supply