Download
1 / 40
420 likes | 532 Views
Explore market equilibrium and efficiency theories, Pareto efficiency, wealth distribution impact, and desirable outcomes in economics. Learn about surplus-enhancing transactions and the role of prices in resource allocation.

E N D
Announcement • I somehow got one lecture ahead of schedule • Will modify syllabus Chapter 7: Efficiency and Exchange
S 3.00 2.50 Price ($/gallon) 2.00 Producer surplus = $4,000/day 1.50 1.00 D .50 0 1 2 3 4 5 6 7 8 9 10 11 12 Quantity (1,000s of gallons/day) Economic Surplus in the Market for Milk Consumer surplus=$2000/day Economic surplus = consumer surplus + producer surplus Chapter 7: Efficiency and Exchange
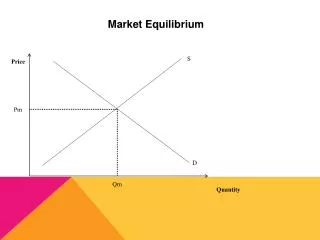
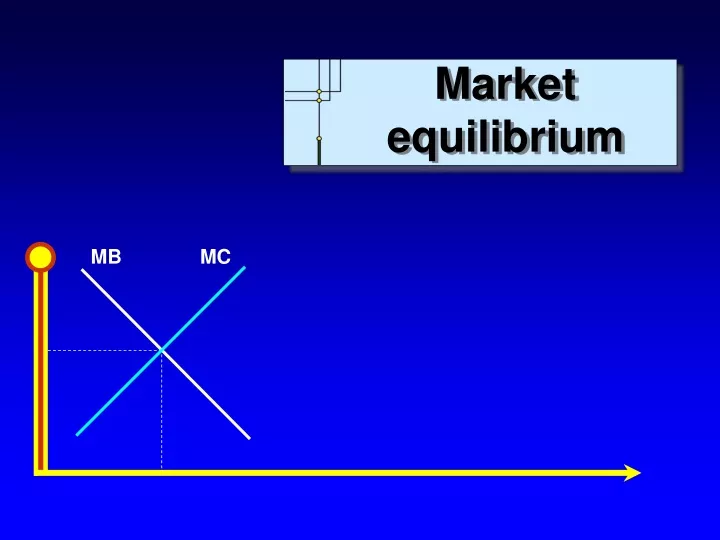
Market Equilibrium and Efficiency • In theory, market equilibriums maximize economic surplus • What do you think? • Is maximizing economic surplus an appropriate desirable end? Is it the sole desirable end? • Is maximizing surplus equitable? Demand=preferences weighted by income • Do markets move toward equilibrium? Chapter 7: Efficiency and Exchange
Housing prices: Equilibrium? Chapter 7: Efficiency and Exchange
What is efficiency? • Are markets efficient? • Measures of efficiency for food systems • What is the desirable end? • What is the input? Chapter 7: Efficiency and Exchange
What is efficiency? • The Economists view: Pareto efficiency • A situation in which there are no transactions available that would make at least one person better off without making anyone else worse off. • Also called Pareto optimality • Different from productive efficiency, i.e. attaining a point on the PPF • Pareto efficiency implies productive efficiency, but not vice versa Chapter 7: Efficiency and Exchange
Think about it: • Would it be efficient if Bill Gates owned everything in the world? • Would it be optimal? Chapter 7: Efficiency and Exchange
Efficiency and equity • Pareto efficiency and Diminishing marginal utility • What’s worth more, $1000 to a rich person or a poor person? • 300 calories to a Zambian or an American? • What makes a greater contribution to happiness? To social welfare? • Should society value an increase in wealth for the poor more than an equal increase for the rich? • What’s actually been happening? Chapter 7: Efficiency and Exchange
Market Equilibrium and Efficiency • A market equilibrium is Pareto efficient • If price and quantity take any other than their equilibrium values, a transaction that will make at least some people better off without harming others can always be found. • 1st fundamental theorem of welfare economics: Any market equilibrium is Pareto efficient Chapter 7: Efficiency and Exchange
Market Equilibrium and Efficiency • A market equilibrium is Pareto efficient • BUT prices are determined by demand, and demand is preferences weighted by wealth and income • There is a different Pareto efficient outcome for every initial distribution of wealth and income • The desirability of the outcome is determined by the desirability of the distribution that gave rise to it. • 2nd fundamental theorem of welfare economics: we can achieve any Pareto equilibrium through lump sum transfers Chapter 7: Efficiency and Exchange
How do we choose between Pareto efficient outcomes? • TWO NEOCLASSICAL ANSWERS: • We don’t • in which case the efficient market equilibrium is no more optimal than the distribution of resources that produced it. • Potential Pareto Optimality • We choose the outcome which could be a Pareto optimum if the winners compensated the losers, i.e. whatever produces most wealth Chapter 7: Efficiency and Exchange
How do we choose between Pareto efficient outcomes? • ONE EE ANSWER: • We solve the distribution problem before we let markets allocate • Just distribution takes precedence over efficient allocation Chapter 7: Efficiency and Exchange
S D A Market in Which Price Is Below the Equilibrium Level 2.50 2.00 1.50 Price ($/gallon) 1.00 .50 1 2 3 4 5 Quantity (1,000s of gallons/day) Chapter 7: Efficiency and Exchange
S 2.50 • If P = $1 then QS = 2,000 gallons/day • At 2,000 gallons the consumer is willing to pay $2 and the MC = $1 • If the buyer pays $1.25 for an extra gallon, producer is $.25 better off, and the consumer is $.75 better off, or economic surplus increases by $1.00 • At $1, the market is not efficient 2.00 1.50 Price ($/gallon) 1.25 1.00 .50 D 1 2 3 4 5 Quantity (1,000s of gallons/day) How Excess Demand Creates an Opportunity for a Surplus-Enhancing Transaction Chapter 7: Efficiency and Exchange
S 2.50 • If P = $2 then QD = 2,000 gallons/day • Additional output costs only $1 • This is $1 less than a buyer would pay • If the buyer pays the seller $1.75, the buyer gains an economic surplus of $0.25 then the seller gains an economic surplus of $0.75 2.00 1.75 1.50 Price ($/gallon) 1.00 .50 D 1 2 3 4 5 Quantity (1,000s of gallons/day) How Excess Supply Creates an Opportunity for a Surplus-Enhancing Transaction Chapter 7: Efficiency and Exchange
If the price of a resource is above or below the equilibrium quantity, which of the following is true? • The quantity exchanged will be less than the equilibrium quantity • There is an opportunity to increase economic surplus • The value on the demand curve (MB) is greater than the value on the supply curve (MC) at that quantity. • Pareto improvements are possible • All of the above Chapter 7: Efficiency and Exchange
Markets will only be efficient when • Buyers and sellers are well informed. • How often is this the case? • NYT: Banks That Bundled Bad Debt Also Bet Against It • What happens as the number of goods proliferates? • Markets are perfectly competitive • Vs. too big to fail Chapter 7: Efficiency and Exchange
Markets will only be efficient when • Supply measures all relevant costs and benefits. • Laws of thermodynamics • Outsourcing • How do we measure these costs? • Demand measures all relevant benefits and costs. • NYT 10-16-10 Income Inequality: Too Big to Ignore by R. Frank “The rich have been spending more simply because they have so much extra money. Their spending shifts the frame of reference...[which make] it substantially more expensive for middle-class families to achieve basic financial goals” Chapter 7: Efficiency and Exchange
Market Equilibrium and Efficiency • What do you think? • Is efficiency the only goal? • Should efficiency be the first goal? • Is efficiency possible? • Most textbooks explicitly state that efficiency is the desirable end Chapter 7: Efficiency and Exchange
The Cost of PreventingPrice Adjustments • Price Ceilings: Do They Help the Poor? • An Example: a Price Ceiling for Home Heating Oil Chapter 7: Efficiency and Exchange
Consumer surplus = $900/day S Producer surplus = $900/day D Economic Surplus in an Unregulated Market for Home Heating Oil 2.00 1.80 1.60 1.40 1.20 1.00 • Without price controls: • Equilibrium Price = $1.40 • Consumer surplus = (1/2)(3,000)(.60) = $900/day • Producer surplus = (1/2)(3,000)(.6) = 900/day • Economic surplus = $1,800/day Price ($/gallon) .80 1 2 3 4 5 8 Quantity (1,000s of gallons/day) Chapter 7: Efficiency and Exchange
Consumer surplus = $900/day Lost economic surplus = $800/day Producer surplus = $100/day The Waste Caused by Price Controls Price Ceiling set at $1.00 S 2.00 1.80 1.60 1.40 1.20 1.00 D Price ($/gallon) .80 • With price controls: • Producer surplus = (1/2)(1,000)(.20) = $100/day or a loss of $800/day • Economic surplus = $1,000 or a loss of $800/day 1 2 3 4 5 8 Quantity (1,000s of gallons/day) Chapter 7: Efficiency and Exchange
The Cost of PreventingPrice Adjustments • Conventional economists say the reduction in economic surplus from a price ceiling will be underestimated when • The consumers who receive the product are not the consumers who value it the most. • BUT demand is most inelastic for the wealthiest consumers • Consumers take costly actions to enhance their chances of being served. Chapter 7: Efficiency and Exchange
The Cost of PreventingPrice Adjustments • Question • What programs could be used to help the poor get heating oil that would be more efficient than a price ceiling? Chapter 7: Efficiency and Exchange
Surplus with price controls Surplus with income transfers and no price controls R R P P With price controls set at $1.00 the economic surplus is $1,000/day *R = economic surplus received by rich people *P = economic surplus received by poor people Without price controls & with income transfers economic surplus is $1,800/day *R & P have the same share and a much larger economic surplus When the Pie Is Larger, Everyone Can Have a Bigger Slice Chapter 7: Efficiency and Exchange
Rationing • In WWII, everyone received a coupon for how much heating oil they could consume. • Rationing was the solution Brazil used for it’s recent energy crisis. California just let prices soar. • Coupons could be traded, going to the consumers that valued it most. Chapter 7: Efficiency and Exchange
Other costs of adjustment • Question • How politically feasible are income transfers relative to price ceilings or tradable ration coupons? Chapter 7: Efficiency and Exchange
The Cost of PreventingPrice Adjustments • Price Subsidies: Do They Help the Poor? The view from mainstream economics • By how much do subsidies reduce total economic surplus in the market for bread? • Assume a small nation imports all its bread at the world price of $2.00 Chapter 7: Efficiency and Exchange
The Reduction in EconomicSurplus from a Subsidy • The cost of the subsidy = $6 million • The benefit of the subsidy = $5 million • Loss of economic surplus = $1 million 5.00 Consumer surplus = $9,000,000/month 4.00 Price of bread ($/loaf) Reduction in total economic surplus = $1,000,000/month 3.00 S 2.00 World price = $ 1.00 D 2 4 6 8 Quantity (millions of loaves/month Chapter 7: Efficiency and Exchange
BUT… • What’s the marginal utility of another loaf of bread to a family with malnourished children? • What’s the future productivity of well-nourished children vs. malnourished ones? Chapter 7: Efficiency and Exchange
NYT Headlines: Ending Famine, Simply by Ignoring the Experts The secret of Malawi’s success: heavy subsidies for fertilizer, farmers say. The World Bank had pressed for their elimination. Chapter 7: Efficiency and Exchange
Pricing of Public Services • Example • How much should a city charge for water, electricity, or some other service essential to life? Chapter 7: Efficiency and Exchange
Ocean 4.0 Lake Spring 0.8 0.2 1 3 The Marginal Cost Curve for Water • Three sources of water • Spring: 1 million gallons/day .02 cents/gallon • Lake: 2 million gallons/day @ .08 cents/gallon • Ocean: 4 cents/gallon Cost (cents/gallon) Water supplied (millions of gallons/day) Chapter 7: Efficiency and Exchange
Ocean 4.0 Lake Spring 0.8 0.2 1 3 The Marginal Cost Curve for Water • Assume • If P = 4 cents/gallon, Q = 4 million gallons • Question • Why should all residents pay 4 cents per gallon? Cost (cents/gallon) Water supplied (millions of gallons/day) Chapter 7: Efficiency and Exchange
Mainstream view • Price = marginal cost • If price is less, people will use more, and cost of supplying more is 4 cents/gallon Chapter 7: Efficiency and Exchange
BUT… • In Cochabamba, Bolivia, marginal pricing led to people spending 25% of income on water, rioting, and death. • How much did Bolivia spend defending Bechtel’s profits? • In South Africa, the rich fill their swimming pools, while the poor drink polluted water, and die of cholera • What are the costs of cholera? Chapter 7: Efficiency and Exchange
Commodity or human right? • Conventional economists look at almost everything as a commodity • Can we distinguish by use? • Water used for essential needs is a human right • Water for non-essential uses is a commodity Chapter 7: Efficiency and Exchange
Why not charge by quantity? • Cost of first 50 gallons/week (essential needs) = .02 cents/gallon • Cost of next 100 gallons/week (important needs) =.08 cents/gallon • All else costs 4 cents/gallon Chapter 7: Efficiency and Exchange