Download
1 / 1
10 likes | 116 Views
Spectral Evolution of the Black Hole X-ray Binary XTE J1752-223 Observed with MAXI nakahira@phys.aoyama.ac.jp http://maxi.riken.jp. and BAT. Satoshi Nakahira , Kazutaka Yamaoka (Aoyama Gakuin Univ), Hitoshi Negoro (Nihon Univ.), Yoshihiro Ueda(Kyoto Univ.) and the MAXI team.

E N D
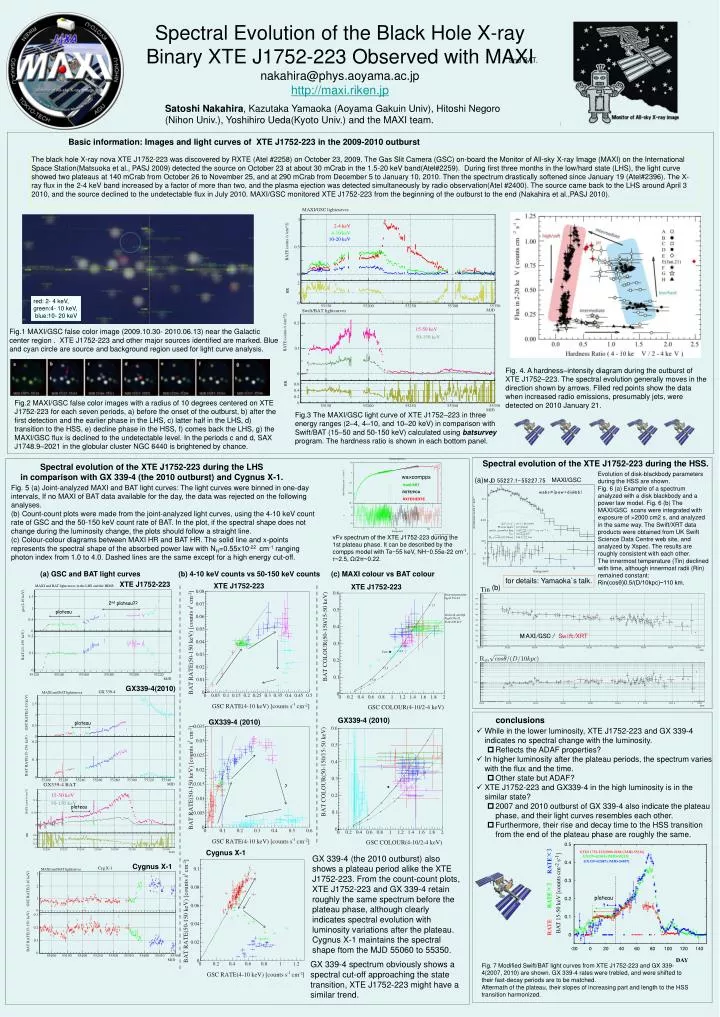
Spectral Evolution of the Black Hole X-ray Binary XTE J1752-223 Observed with MAXI nakahira@phys.aoyama.ac.jp http://maxi.riken.jp and BAT. Satoshi Nakahira, Kazutaka Yamaoka (Aoyama Gakuin Univ), Hitoshi Negoro (Nihon Univ.), Yoshihiro Ueda(Kyoto Univ.) and the MAXI team. Basic information: Images and light curves of XTE J1752-223 in the 2009-2010 outburst The black hole X-ray nova XTE J1752-223 was discovered by RXTE (Atel #2258) on October 23, 2009. The Gas Slit Camera (GSC) on-board the Monitor of All-sky X-ray Image (MAXI) on the International Space Station(Matsuoka et al., PASJ 2009) detected the source on October 23 at about 30 mCrab in the 1.5-20 keV band(Atel#2259). During first three months in the low/hard state (LHS), the light curve showed two plateaus at 140 mCrab from October 26 to November 25, and at 290 mCrab from December 5 to January 10, 2010. Then the spectrum drastically softened since January 19 (Atel#2396). The X-ray flux in the 2-4 keV band increased by a factor of more than two, and the plasma ejection was detected simultaneously by radio observation(Atel #2400). The source came back to the LHS around April 3 2010, and the source declined to the undetectable flux in July 2010. MAXI/GSC monitored XTE J1752-223 from the beginning of the outburst to the end (Nakahira et al.,PASJ 2010). red: 2- 4 keV, green:4- 10 keV, blue:10- 20 keV Fig.1 MAXI/GSC false color image (2009.10.30- 2010.06.13) near the Galactic center region . XTE J1752-223 and other major sources identified are marked. Blue and cyan circle are source and background region used for light curve analysis. Fig. 4. A hardness–intensity diagram during the outburst of XTE J1752–223. The spectral evolution generally moves in the direction shown by arrows. Filled red points show the data when increased radio emissions, presumably jets, were detected on 2010 January 21. Fig.2 MAXI/GSC false color images with a radius of 10 degrees centered on XTE J1752-223 for each seven periods, a) before the onset of the outburst, b) after the first detection and the earlier phase in the LHS, c) latter half in the LHS, d) transition to the HSS, e) decline phase in the HSS, f) comes back the LHS, g) the MAXI/GSC flux is declined to the undetectable level. In the periods c and d, SAX J1748.9–2021 in the globular cluster NGC 6440 is brightened by chance. Fig.3 The MAXI/GSC light curve of XTE J1752–223 in three energy ranges (2–4, 4–10, and 10–20 keV) in comparison with Swift/BAT (15–50 and 50-150 keV) calculated using batsurvey program. The hardness ratio is shown in each bottom panel. Spectral evolution of the XTE J1752-223 during the HSS. Spectral evolution of the XTE J1752-223 during the LHS in comparison with GX 339-4 (the 2010 outburst) and Cygnus X-1. Evolution of disk-blackbody parameters during the HSS are shown. Fig. 6 (a) Example of a spectrum analyzed with a disk blackbody and a power law model. Fig. 6 (b) The MAXI/GSC scans were integrated with exposure of >2000 cm2 s, and analyzed in the same way. The Swift/XRT data products were obtained from UK Swift Science Data Centre web site, and analyzed by Xspec. The results are roughly consistent with each other. The innermost temperature (Tin) declined with time, although innermost radii (Rin) remained constant: Rin(cosθ)0.5/(D/10kpc)~110 km. (a) MAXI/GSC Fig. 5 (a) Joint-analyzed MAXI and BAT light curves: The light curves were binned in one-day intervals, If no MAXI of BAT data available for the day, the data was rejected on the following analyses. (b) Count-count plots were made from the joint-analyzed light curves, using the 4-10 keV count rate of GSC and the 50-150 keV count rate of BAT. In the plot, if the spectral shape does not change during the luminosity change, the plots should follow a straight line. (c) Colour-colour diagrams between MAXI HR and BAT HR. The solid line and x-points represents the spectral shape of the absorbed power law with NH=0.55x10⁻²² cm-1 ranging photon index from 1.0 to 4.0. Dashed lines are the same except for a high energy cut-off. νFν spectrum of the XTE J1752-223 during the 1st plateau phase. It can be described by the compps model with Te~55 keV, NH~0.55e-22 cm-1, τ~2.5, Ω/2π~0.22. (a) GSC and BAT light curves (b) 4-10 keV counts vs 50-150 keV counts (c) MAXI colour vs BAT colour for details: Yamaoka`s talk. XTE J1752-223 XTE J1752-223 XTE J1752-223 (b) 2nd plateau?? plateau GX339-4(2010) conclusions GX339-4 (2010) GX339-4 (2010) plateau • While in the lower luminosity, XTE J1752-223 and GX 339-4 indicates no spectral change with the luminosity. • Reflects the ADAF properties? • In higher luminosity after the plateau periods, the spectrum varies with the flux and the time. • Other state but ADAF? • XTE J1752-223 and GX339-4 in the high luminosity is in the similar state? • 2007 and 2010 outburst of GX 339-4 also indicate the plateau phase, and their light curves resembles each other. • Furthermore, their rise and decay time to the HSS transition from the end of the plateau phase are roughly the same. ? plateau Cygnus X-1 GX 339-4 (the 2010 outburst) also shows a plateau period alike the XTE J1752-223. From the count-count plots, XTE J1752-223 and GX 339-4 retain roughly the same spectrum before the plateau phase, although clearly indicates spectral evolution with luminosity variations after the plateau. Cygnus X-1 maintains the spectral shape ftom the MJD 55060 to 55350. Cygnus X-1 plateau ? GX 339-4 spectrum obviously shows a spectral cut-off approaching the state transition, XTE J1752-223 might have a similar trend. Fig. 7 Modified Swift/BAT light curves from XTE J1752-223 and GX 339-4(2007, 2010) are shown. GX 339-4 rates were trebled, and were shifted to their fast-decay periods are to be matched. Aftermath of the plateau, their slopes of increasing part and length to the HSS transition harmonized.