Download
1 / 39
420 likes | 599 Views
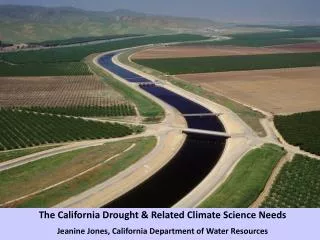
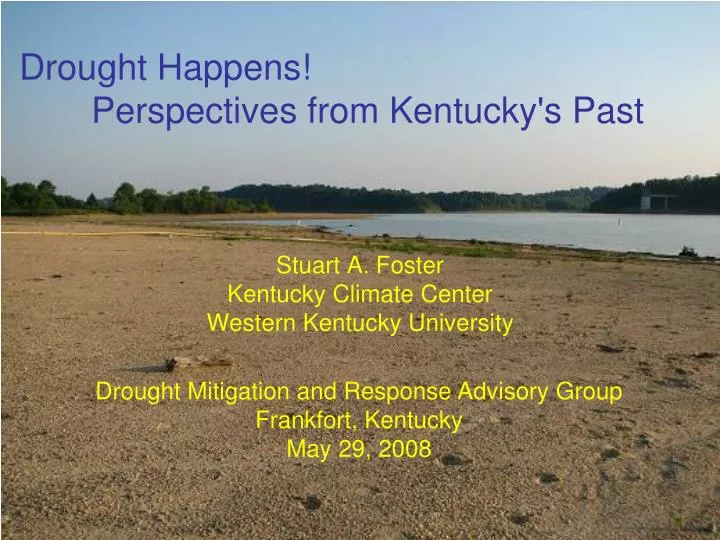
Drought Happens! Perspectives from Kentucky's Past. Stuart A. Foster Kentucky Climate Center Western Kentucky University. Drought Mitigation and Response Advisory Group Frankfort, Kentucky May 29, 2008. Drought of 2007. April 3 rd. August 21 st.

E N D
Drought Happens! Perspectives from Kentucky's Past Stuart A. Foster Kentucky Climate Center Western Kentucky University Drought Mitigation and Response Advisory Group Frankfort, Kentucky May 29, 2008
Drought of 2007 April 3rd August 21st Source: U.S. Drought Monitor, Weekly Archives
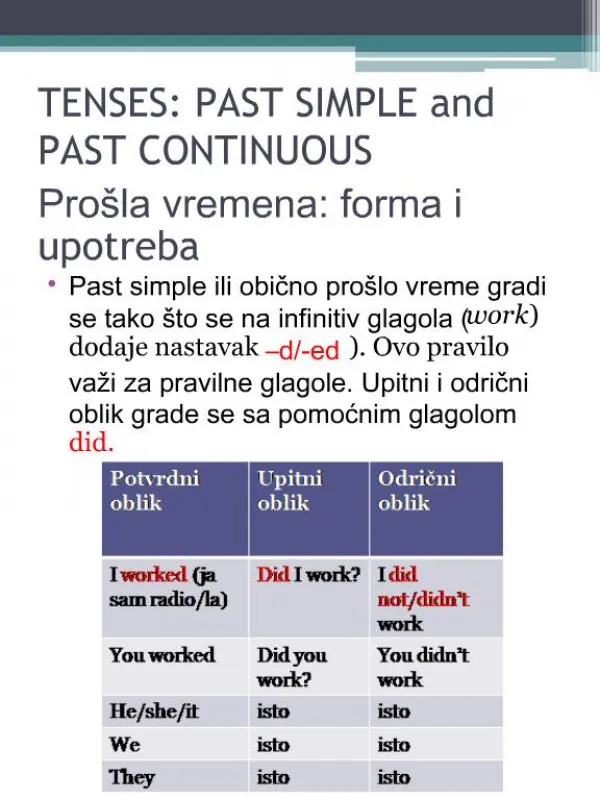
Drought of 2007Monthly Precipitation Totals • The onset of drought could be traced to the later winter and early spring. • By mid May concern about the potential for severe drought in Kentucky was recognized. • Drought intensified sharply in August, when below normal precipitation was combined with record heat. • Unexpected relief came with heavy rains in October, normally the driest month of the year. Precipitation measured in inches.
Drought of 2007 Socio-economic Impacts • Reduced crop yields • Stress on fish, wildlife, and livestock • Damage to trees and shrubs • More frequent wild fires • Water use restrictions imposed • Limited recreational opportunities • Increased power costs
Accounts of the Drought of 2007 “The Environmental and Public Protection Cabinent (EPPC) today announced the Louisville and Huntington (W. Va.) districts of the U.S. Army Corps of Engineers (USACE) will issue permits for the temporary withdrawal of water from 13 USACE-operated reservoirs in Kentucky.” ~ Environmental and Public Protection Cabinet News Release, September 24, 2007 “There’s a need and we’ve got water. The current drought conditions have caused water shortage problems for large and small businesses and communities around the state. This policy was put into place for just such emergencies” ~ Dave Meadows, Chief of the Water Resources Engineering Branch, USACE Huntington District
A Philosophical Perspective on Drought “Drought is an experience, not an event.” • If a tree falls in the woods, but no one is there to hear it fall, does it make a sound? • If a deficit of precipitation built over a period, but no one was adversely affected, did a drought occur?
Meteorological Agricultural Hydrological Socio-economic Definitions of Drought “The next challenge? Moving from conceptual to operational definition.”
Dimensions of Drought in Space and Time “Every drought has its own signature.” • Onset • Duration • Peak Intensity • Extent
Drought Years in Kentucky • 1854 • 1881 • 1901 • 1904 • 1908 • 1913-14 • 1930 • 1936 • 1941 • 1953-54 • 1988 • 1999-2000 • 2007
Accounts of the Drought of 1854 “There no longer exists a hope that in this section there will be made even a half crop of corn. In fact in some localities, it will not be up to a fourth. This is creating an extraordinary panic, and we regret to see so much distress, but it behooves all to meet what is to come with fortitude, and not to despond.” ~ Somerset Gazette
Drought of 1854Monthly Precipitation Totals • “Many of our citizens are perambulating our streets all night. Can’t sleep; the weather too hot. Mercury at midnight 90.” The Tri-Weekly Commonwealth, Frankfort, KY, Sept 8, 1854 (reprinted from the Hopkinsville Press) • “The bed of the river is getting to be very dusty. Some of the sand bars are hot enough to fry fish.” The Kentucky Standard, Bowling Green, KY, Saturday Morning, September 9, 1854 • “A drove of three hundred and fifty cattle forded across the Ohio river, a short distance above Cincinnati, on Friday.” The Tri-Weekly Commonwealth, Frankfort, KY, Sept 20, 1854 Precipitation measured in inches.
Accounts of the Drought of 1854 “The thermometer stood at 102° on last Monday. Most of the Irish potatoes were baked in the ground.” “Our Town Marshall is now engaged in digging a large cistern on the East side of the Court House Yard. This is highly commendable in our liberal and enterprising Trustees.” “Edmondson county is again without a lawyer, She is certainly blessed in that particular” The Kentucky Standard, Bowling Green, KY, Saturday Morning, September 9, 1854
Drought of 1904Monthly Precipitation Totals • Drought developed gradually beginning in spring, continuing through summer, and intensifying significantly during October and November • Temperatures during the summer were generally quite pleasant, ranking among the coolest 1/3 of summers on record in Kentucky. • The maximum temperature during the year was 100 on one day at one location in Cadiz on August 12th. Precipitation measured in inches.
Drought of 1930 • Peak 12-month precipitation deficits reached 50% of normal. • A record high temperature was set in Greensburg of 114°F in. Daily maximum temperature exceeded 100F on 15 days in July.
Accounts of the Drought of 1930 “… increased illness because of the drouth had caused a situation that need attention, because of lack of medicine and care for many poor families and that many others faced starvation this coming winter unless aid is extended. …” (August 14, 1930, Vol. LXXI, No. 11) “It is extremely unusual for rabbits to go swimming but natural history is being rewritten during this long drouth and heat wave.” (July 31, 1930, Vol. LXXI, No. 9 )
Accounts of the Drought of 1988 • Decreased crop yields were combined resulted in an estimated statewide loss of $400-600 million. • Livestock were sold at record mid-summer volumes, as livestock were losing weight and feed prices were soaring. • Water utilities were stressed, and several experienced significant increases in operating costs attempting to meet water quantity demands and water quality requirements.
The Challenge Environmental realities: Natural climatic variability results in periodic drought … … Societal expectations: Uninterrupted supply of water to meet social and economic needs
Water Production: Climate Precipitation varies in its frequency, intensity, and amount. Climate variability and change add uncertainty to regional water supply planning. Water Storage 1. To what extent do rivers, streams, lakes, reservoirs, and groundwater sources reliably meet societal needs? Water Delivery 2. To what extent is infrastructure adequate to acquire and distribute water to meet societal needs? Water Demand 3. To what extent can technology, education, and pleas for conservation reduce societal needs? Society requires water in accordance with the population, its cultural life style, and the structure of the regional economy. Water Consumption: Society
North America Climate Projections Regional Climate Projections. In: Climate Change 2007: The Physical Science Basis. Contribution of Working Group I to the Fourth Assessment Report of the Intergovernmental Panel on Climate Change.
Kentucky’s Climate Divisions “Regions, you can’t live with them, you can’t live without them.”
Diversity of Land Use and Land Cover Diverse physiographic regions ranging from flat to rolling cropland and pastures to forested hills and mountain ridges complicate the nature of drought vulnerability http://www.uky.edu/KentuckyAtlas/kentucky-atlasp.html Changing practices of agriculture, mining, and forestry, along with urbanization alter drought vulnerability. http://gisdata.usgs.net/website/kentucky/viewer.php
The Kentucky Mesonet: Meeting the Challenge of Drought Monitoring Observations collected once a day and often not available for four months ◄ Observations collected every 5 minutes, 24 hours a day, 365 days a year and available in near real time ►
Station ConfigurationKentucky Mesonet Sensor Package • Air temperature • Precipitation • Solar radiation • Relative humidity • Wind speed and direction • Soil moisture and temperature Integrated IT Infrastructure • Data logger • Cellular digital modem “A scalable infrastructure for environmental monitoring across Kentucky”
KENTUCKY MESONET Climatological Data http://kymesonet.orgSample Data Products
Summary • Drought is a recurrent feature of Kentucky’s climate. It has happened before; it will happen again. • Droughts are unique. They can be characterized by their onset, duration, peak intensity, and extent. • Conceptual definitions (meteorological, agricultural, hydrological, and socio-economic ) must be linked to effective operational definitions of drought. • Climate change scenarios enhance drought risk, though risk is related more to variability than trend. • Projected population and economic growth portend increased societal risk associated with drought. • Enhanced monitoring enables more accurate, timely, and geographically targeted information to support drought mitigation, response, and assessment efforts.