Download
1 / 24
240 likes | 435 Views
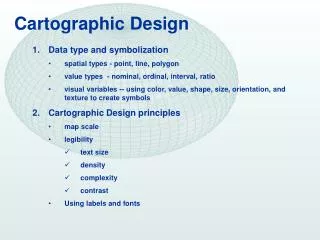
Cartographic Design. Advanced GIS Workshop April 28-29, 2012 Antioch University New England Chris Brehme Keene State College. Generalization. Image from Paul Bolstad , GIS Fundamentals 3 rd Edition, 2010. Generalization. Generalization.

E N D
Cartographic Design Advanced GIS Workshop April 28-29, 2012 Antioch University New England Chris Brehme Keene State College
Generalization Image from Paul Bolstad, GIS Fundamentals 3rd Edition, 2010
Generalization to represent the same data at different scales—e.g. Google Maps.
Terrain Modeling • Begin with DEM • Sources (NH GRANIT, MassGIS, etc.; USGS Seamless Server) • Run Hillshade • ‘Sun’ Angle and Azimuth can be determined from a website: http://www.susdesign.com/sunangle/ • Overlay with Aerial Imagery, set to semi-transparent to create a ‘Swiss Map’ style
Matching Representation to Reality Federal Income Individual Income Geographic Phenomena Symbolization Space Alan MacEachren, How Maps Work, 1995
Dasymetric Mapping Method for ‘disaggregating’ data. Data collected at a coarse spatial aggregation are mapped more precisely using additional geographic data For example, census data collected in tracts is allocated to the built environment as it is identified.
Cheshire County Population Example • Cheshire County population by Town • Land Cover from USGS MRLC • Extract Land Cover to Cheshire County and reclassify: • Each developed class remains the same • All other classes = 1
Cheshire County Population Example • Convert LandCover raster to polygon, intersect with Town Pop. • Each town has four multipart polygons: • One polygon for each development class • Create ‘scores’ for each class type • Sparse development = .075 • Low development = .125 • Moderately developed = .25 • Intensely developed = .6
Cheshire County Population Example 1 dot = 1 person What are some of the flaws? Use Field calculator to multiply the ‘score’ by the population of each town Population is now confined to the developed areas
Map Series • Time Series (same data represented over days, seasons, years) • Thematic Series (different data layers covering the same location) • Use Multiple Data Frames to create a Map Layout • Use ‘Import Symbology’ to transfer the classes and colors from one legend to another • Legend classes must encompass the entire range of the data