Download
1 / 29
290 likes | 438 Views
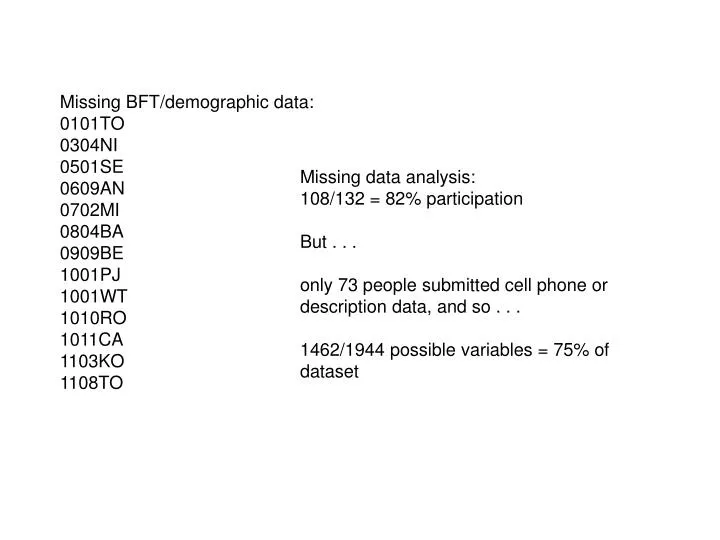
Missing BFT/demographic data: 0101TO 0304NI 0501SE 0609AN 0702MI 0804BA 0909BE 1001PJ 1001WT 1010RO 1011CA 1103KO 1108TO. Missing data analysis: 108/132 = 82% participation But . . . only 73 people submitted cell phone or description data, and so . . .

E N D
Missing BFT/demographic data: 0101TO 0304NI 0501SE 0609AN 0702MI 0804BA 0909BE 1001PJ 1001WT 1010RO 1011CA 1103KO 1108TO Missing data analysis: 108/132 = 82% participation But . . . only 73 people submitted cell phone or description data, and so . . . 1462/1944 possible variables = 75% of dataset
Hartshorne & May (1928) average r = .23 (R2 = .05) HONESTY lying classroom cheating stealing money cheating at a game take-home exam cheating
* r = -.23
The relationship between x and y depends on z: “Interaction” Interactionism in personality: The relationship between p and behavior depends on the situation
The relationship between x and y depends on z: “Interaction”
Anorexia and bulimia rates, 1975-1986 Main effects? Interaction?
Self Quiz • What are the two most important aspects of describing a correlation? • What would lead to you distrust a correlation? • What is the only remaining controversy from Mischel’s book, Personality and Assessment? How have the others been resolved? • What can an interaction do that a correlation cannot? • Describe the effects (main and/or interaction) associated with this graph:
People and their environments: 3 kinds of interaction People react differently to their environments “reactive” interaction same as statistical interaction Environments react differently to people “evocative” interaction same as statistical interaction People select their environments “proactive” interaction This last kind of interaction is not the same as statistical interaction; creates a correlation between personality and the environment (main effect).
MODEL 1 Personality traits do not change: Correlations (p. 49) Over 6 years . . . Men Women Spouses O .81 .73 .80 C .76 .71 E .86 .73 .77 A .59 .55 N .81 .81 .83 The most open, conscientious, extraverted, agreeable, and neurotic people will also tend to be highest on those personality traits 6 years later . . . at least, that’s the way they see themselves . . . are spousal ratings any better? Consistency also increases with age throughout the adult lifespan and peaks at around age 50: cumulative continuity principle
MODEL 2 Personality traits are a blueprint for change: Life changes amplify personality predispositions Behavior problems in 1972 Behavior problems in 1973 Menarche Agreeableness Marriage Proactive interactions amplify personality: corresponsive principle
MODEL 3 Change in personality in response to experiences: Life changes personality People become more socially dominant, agreeable, conscientious, and emotionally stable with age: principle of maturity Roberts & Mroczek, in press
Why do so many people change in adulthood? • Identities are tied to social roles such as work, marriage, family, and community • Social roles call for becoming more socially dominant, agreeable, conscientious, and emotionally stable • Most of these social roles are developed in early adulthood • Together, these changes comprise the social identity principle • How could the social identity principle account for the three models of personality continuity?