Download
1 / 38
380 likes | 953 Views
ODS Statistical Graphics November 10, 2004 Linda Atkinson Overview ODS for Statistical Graphics enables you to create statistical graphics as automatically as tables are currently created

E N D
ODS Statistical Graphics November 10, 2004 Linda Atkinson
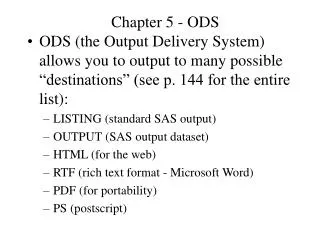
Overview • ODS for Statistical Graphics • enables you to create statistical graphics as automatically as tables are currently created • provides commonly used displays, including scatter plots, histograms, box-and-whisker plots, and contour plots, in ODS output • is experimental in SAS 9.1
Procedures • Procedures supporting ODS Graphics in SAS 9.1: • Base SAS▪ TIMESERIES • CORR ▪ UCM • SAS/ETS▪ VARMAX • ARIMA ▪ X12 • AUTOREG SAS High-Performance Forecasting • ENTROPY ▪ HPF • EXPAND • MODEL • SYSLIN
Procedures (cont.) • SAS/STAT • ANOVA ▪ LOGISTIC • CORRESP ▪ MI • GAM ▪ MIXED • GENMOD ▪ PHREG • GLM ▪ PRINCOMP • KDE ▪ PRINQUAL • LIFETEST ▪ REG • LOESS ▪ ROBUSTREG
A Simple Example ods html; ods graphics on; procreg data=sashelp.class; model weight=height; run; quit; ods graphics off; ods html close;
Specifying a Destination ods pdf file='d:\odsdemo\diagnostics.pdf'; ods graphics on; procreg data=sashelp.class; model weight=height; run; quit; ods graphics off; ods pdf close;
Changing style ods pdf file='d:\odsdemo\diagnostics.pdf' style=analysis; ods graphics on; procreg data=sashelp.class; model weight=height; run; quit; ods graphics off; ods pdf close;
Recommended styles • Four SAS-supplied styles are recommended for use with ODS Graphics: • Analysis • Default • Journal • Statistical
Default Style Journal Style Analysis Style Statistical Style
Selecting graphs ods html style=default; ods graphics on; ods trace on; /* Lists the output objects created by ODS. */ proc reg data=sashelp.class plots(unpack); /* UNPACK option displays plots individually instead of in a panel. */ model weight=height; run; quit; ods graphics off; ods html close; ods trace off;
Trace output Output Added: ------------- Name: ResidualHistogram Label: Residual Histogram Template: Stat.REG.Graphics.ResidualHistogram Path: Reg.MODEL1.ObswiseStats.Weight.DiagnosticPlots.ResidualHistogram ------------- Output Added: ------------- Name: ResidualByPredicted Label: Residual By Predicted Template: Stat.REG.Graphics.ResidualByPredicted Path: Reg.MODEL1.ObswiseStats.Weight.DiagnosticPlots.ResidualByPredicted -------------
Selecting graphs (cont.) ods html style=default; ods graphics on; ods select residualhistogram; procreg data=sashelp.class plots(unpack); model weight=height; run; quit; ods graphics off; ods html close;
Graph specification example ods html; ods graphics on; proclifetest data=BMT; time T * Status(0); survival plots=(survival, hwb); strata Group; run; ods graphics off; ods html close;
Changing image file type ods html; ods graphics on / imagefmt=jpeg; proclifetest data=BMT; time T * Status(0); survival plots=(survival, hwb); strata Group; run; ods graphics off; ods html close;
Creating graphs with tool tips ods html file='d:\odsdemo\boxplots.html' gpath='d:\odsdemo'; /* gpath option specifies where to store graphics image files */ ods graphics on / imagefmt=staticmap; /* staticmap option generates image map of coordinates for tool tips */ procmixed data=pr method=ml boxplot(npanel=15); class Person Gender; model y = Gender Age Gender*Age; random intercept Age / type=un subject=Person; run; ods graphics off; ods html close;
Customizing Graphs ods html; ods graphics on; procrobustreg data=growth plot=resqqplot; model GDP = LFG GAP EQP NEQ; run; ods graphics off; ods html close;
Reverting to Default Templates Customized templates are stored in Sasuser.Templat or in user-defined template stores. The default templates provided by SAS are saved in the read-only template store Sashelp.Tmplmst. Consequently, if you have modified any of the default templates and you want to create ODS Graphics with the original default templates, one way to do so is by changing your ODS path as follows. ods path sashelp.tmplmst(read) sasuser.templat(update);
Modifying Styles proctemplate; define style styles.DemoStyle; parent=styles.Default; replace StatGraphFitLine / linestyle=2; end; run; ods html style=DemoStyle; ods graphics on; procrobustreg data=growth plot=resqqplot; model GDP = LFG GAP EQP NEQ; run; ods graphics off; ods html close;
References “An Introduction to ODS for Statistical Graphics in SAS 9.1”, Robert N. Rodriguez, SUGI 29 Conference Proceedings, SAS Institute Inc., 2004. http://www2.sas.com/proceedings/sugi29/204-29.pdf “Statistical Graphics Using ODS (Experimental), SAS/STAT User’s Guide, SAS 9.1 online documentation; “TEMPLATE Procedure: Creating ODS Statistical Graphics Output (Experimental)”; and “ODS Statistical Graphics (Experimental) and ODS Styles: Usage and Reference”, all at http://support.sas.com/rnd/base/topics/statgraph/
Additional Papers “Thumbs Up for ODS Graphics, But Don’t Throw Out All Your SAS/GRAPH Programs!”, Rick M Mitchell, SUGI 29 Conference Proceedings, SAS Institute Inc., 2004. http://www2.sas.com/proceedings/sugi29/083-29.pdf “Let the Data Speak: New Regression Diagnostics Based on Cumulative Residuals”, Gordon Johnston and Ying So, SUGI 28 Conference Proceedings, SAS Institute Inc., 2003. http://www2.sas.com/proceedings/sugi28/255-28.pdf