Download
1 / 24
240 likes | 387 Views
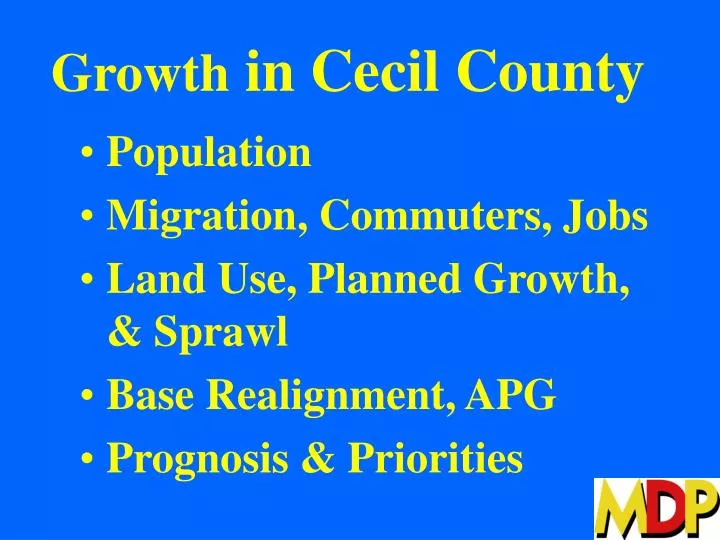
Growth in Cecil County. Population Migration, Commuters, Jobs Land Use, Planned Growth, & Sprawl Base Realignment, APG Prognosis & Priorities. Population & Change. Cecil County. Total Population in Cecil County, Actual and Projected. Almost doubles.

E N D
Growth in Cecil County • Population • Migration, Commuters, Jobs • Land Use, Planned Growth, & Sprawl • Base Realignment, APG • Prognosis & Priorities
Population & Change Cecil County
Total Population in Cecil County, Actual and Projected Almost doubles
Population Increases, Cecil County, Actual & Projected, by Decade
Population Change in Cecil County by Major Age Groups, 2000-2010 64% 23% 12%
Population Change in Cecil County by Major Age Groups, 2010-2020 23% 23% 54%
Population Change in Cecil County by Major Age Groups, 2020-2030 27% 27% 45%
Annual Rate of Population Change in Cecil County, Actual & Projected, by Decade
Annual Rate of Total Population Change in Remainder of Maryland, Actual & Projected
Migration, Commuters, & Jobs Cecil County
>1/2 Pop’n Increase, ’90s
Net Commutation for Cecil County(In commuters minus out commuters) Net Out Commutation increases by nearly 19,000 between 2000 and 2030 Source: U.S. Census, U.S. BEA and the Maryland Department of Planning
Annual Rate of Total Job Change in Cecil County, Actual & Projected
Land Use,Planned Growth, & Sprawl Cecil County
Growth in Cecil County Increase Est. Increase 180% 1973 to 2002 2002 to 2030 160% Development Development 140% 159% 127% 120% Population 100% 77% Population 80% 61% 60% 40% 20% 0%
Residential Single Family Sales Above $300,000 (Median) 2002 By Census Tract
Residential Single Family Sales Above $300,000 (Median) 2005 By Census Tract
Base Re-alignment: APG Givens • Transferred military jobs: 4,700 • Additional contractual jobs: 2 to 3 times • Estimate: total of 10,000 to 12,000 Questions • In-commuters? • Workweek residents? • Market preferences: Cecil / PFAs / NAR / SAR? • Water/sewer, growth plans, ordinances
Prognosis • Fast growth 2000 – 2030 • Heavy in-migration + aging population • More out-commuters • Richer market for development products • More loss of land than population increase • Major threat to high quality environment
Priorities • Its all about the market • Plans/programs for water / sewer, Smart Growth • Development incentives for diverse, high quality communities in planned areas • Subdivision and development restrictions & more preservation outside Priority Funding Areas