Download
1 / 55
550 likes | 645 Views
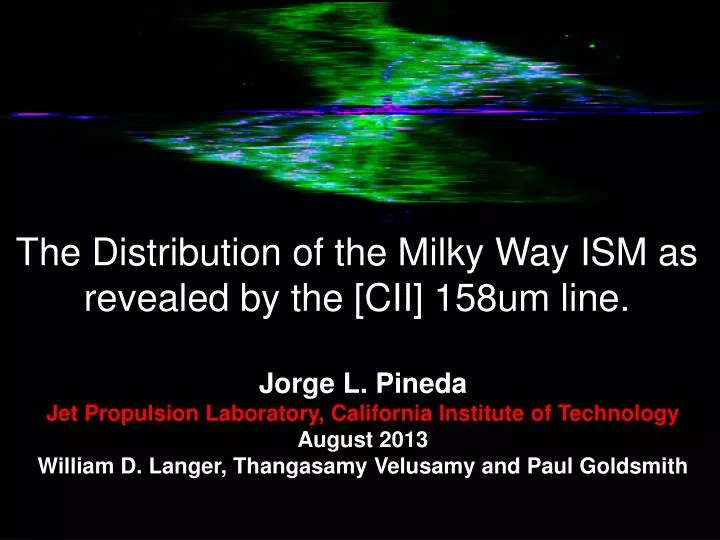
The Distribution of the Milky Way ISM as revealed by the [CII] 158um line. Jorge L. Pineda Jet Propulsion Laboratory, California Institute of Technology August 2013 William D. Langer, Thangasamy Velusamy and Paul Goldsmith. Photon Dominated Regions (PDRs).

E N D
The Distribution of the Milky Way ISM as revealed by the [CII] 158um line. Jorge L. Pineda Jet Propulsion Laboratory, California Institute of Technology August 2013 William D. Langer, Thangasamy Velusamy and Paul Goldsmith
Photon Dominated Regions (PDRs) Herschel/WADI ; e.g. Dedes et al. 2010 KAO: e.g. Boreikoet al. 1998 SOFIA ; e.g. Schneider et al. 2012
COBE/FIRAS; 7deg angular resolution; 1000 km/sec velocity resolution Origin? WIM (Heiles et al. 1994) CNM (Bennett et al. 1994) PDRs (e.g. Cubick et al. 2008) BICE; 15arcmin angular resolution; 175 km/sec velocity resolution Galactic Longitude [Degrees]
GOT C+ [CII] 1.9 THz Survey 11 LOS 11 LOS 10 LOS 11 LOS 7 LOS 6 LOS 7 LOS 6 LOS Galactic Plane Survey - systematic volume weighted sample of ≈500 LOSs in the disk • Concentrated towards inner Galaxy • Sampled lat b = 0o, +/- 0.5o & 1o Galactic Central Region: CII strip maps sampling ≈300 positions in On The Fly (OTF) mapping mode.
GOT C+ [CII] Distribution in the Milky Way Spiral arm tangents Pineda et al. (2013) A&A 554, A103
Dense and Cold Molecular Gas (CO) [CII] traces the transition between atomic and molecular clouds.
HI Data from: SGPS, VGPS, and CGPS
HI HI+CO Data from: Mopraand CSO
HI HI+CO CII+HI CII+HI+CO Diffuse Cold Dense Warm Dense
[CII] as a tracer of the Warm Ionized Medium • WIM: T=8000K, low volume densities, traced by [CII] and [NII], H-alpha, and radio continuum. • Suggested to be the origin of the [CII] emission in the Milky Way observed by COBE (Heiles et al. 1994). • But it is a small fraction of total [CII] observed by GOTC+ (Pineda et al. 2013, see later). Bennett et al. 1994
[CII] as a tracer of the Warm Ionized Medium • WIM: T=8000K, low volume densities, traced by [CII] and [NII], H-alpha, and radio continuum. • Suggested to be the origin of the [CII] emission in the Milky Way observed by COBE (Heiles et al. 1994). • But it is a small fraction of total [CII] observed by GOTC+ (Pineda et al. 2013, see later). Steiman-Cameron et al. 2008
GOT C+ [CII] detection of WIM in Spiral Arm Tangency Velusamy, Langer et al. 2012, A&A 541,L10 G026.1+0.0 [CII] [CII] excess tracing WIM HI CO The geometry of the Scutum-Crux (S-C) arm is very favorable to detect weak [CII] emission from the WIM and study its structure and kinematics
Warm Ionized Medium: [NII] Goldsmith et al. (2013) in prep
Herschel PACS/HIFI [NII] • Relative Intensity of Two [NII] Lines Yields n(e). • [NII] 122um/205um = 1.4 ne=30 cm-3. • Radio Continuum observations give EM=6500 cm-6 N(H+)=2x21 cm-2. • In this region 30% of the [CII] emission comes from ionized gas.
GOT N+ Survey 11 LOS 11 LOS 10 LOS 11 LOS 7 LOS 6 LOS 7 LOS 6 LOS • OT2 Project. PI: Paul Goldsmith • All GOT C+ LOSs with b=0, observed in [NII] 205 um and 122um with PACS • Selected lines of sights in [NII] 205um with HIFI
Warm and Cold Neutral gas: Thermal balance of diffuse atomic gas results in two phases in nearly thermal equilibrium (Pike’Ner 1968; Field et al 1969;Wolfire et. al. 1995, 2003) Cold Neutral Medium (CNM): T=80 K, n=50 cm-3 Warm Neutral Medium (WNM): T=8000 K, n=0.5 cm-3 Wolfire et al. (2003)
Warm and Cold Neutral gas: Thermal balance of diffuse atomic gas results in two phases in nearly thermal equilibrium (Pike’Ner 1968; Field et al 1969;Wolfire et. al. 1995, 2003) Cold Neutral Medium (CNM): T=80 K, n=50 cm-3 Warm Neutral Medium (WNM): T=8000 K, n=0.5 cm-3 Wolfire et al. (2003)
Warm and Cold Neutral gas: • The 21cm line traces column density only; it is impossible to discern between CNM or WNM gas using this line. • But CNM can be observed with HI seen in absorption towards extragalactic continuum sources (e.g. Heiles & Troland 2003, Dickey et al. 2009 ). • Heiles & Troland 2003:50% of the mass in unstable conditions -> Turbulence dominates over Thermal instability(Vasquez-Semadeni 2009) • Wolfire 2010, IAU: 15% of the mass in unstable conditions -> • Thermal Instability still important Heiles & Troland (2003)ApJ 586, 1067
Warm and Cold Neutral gas: • The [CII] emission traces the diffuse neutral gas but is sensitive to density and temperature. • CII∝ N(C+)nh*exp(-91.3K/Tkin) • For typical WNM and CNM conditions, the [CII] associated with WNM is a factor of ~20 weaker than that from the CNM. WNM is below our sensitivity limit. • We use the GOT C+ survey to separate the CNM and WNM components from the HI position velocity map of the Galaxy.
Warm and Cold Neutral gas: • The [CII] emission traces the diffuse neutral gas but is sensitive to density and temperature. • CII∝ N(C+)nh*exp(-91.3K/Tkin) • For typical WNM and CNM conditions, the [CII] associated with WNM is a factor of ~20 weaker than that from the CNM. WNM is below our sensitivity limit. • We use the GOT C+ survey to separate the CNM and WNM components from the HI position velocity map of the Galaxy. Pineda et al. (2013) A&A 554, A103
Warm and Cold Neutral gas: • Atomic gas in the inner galaxy dominated by CNM gas. • Inner Galaxy results consistent with those from Kolpak et. al 2002. • Outer galaxy is 10-20% CNM, consistent with Dickey et al. (2009). • Average CNM fraction is 43%. • Local CNM fraction of the total gas consistent with Heiles & Troland(2003). Pineda et al. (2013) A&A 554, A103
CO-“Dark” H2 Gas Hollenbach and Tielens (1997)
CO-“Dark” H2 Gas • Observations: • Gamma-Rays (e.g. Grenier et al. 2005) • Dust Continuum (e.g. Reach 1994) • CO absorption (e.g. Lizst & Pety 2012) • [CII] Emission (e.g. Langer et al. 2010) Hollenbach and Tielens (1997)
CO-Dark H2 : Theory (Wolfire et al. 2010, ApJ 716 1191) • Assumes two-phase turbulent medium • Thickness of CO-dark H2 layer constant • Mass fraction of CO-dark H2 constant; f~0.3
CO-Dark H2 : Theory • Simulations are incorporating treatment of chemistry and grain physics, allowing the comparison with observations (e.g. Shetty et al. 2012, Levrier et al. 2012). (Levrier et al. 2012)
CO-Dark H2 : Observations in 2D: Technique: Gamma-Rays Method: Correlate the Gamma-ray intensity and N(HI), Xco*Wco, E(B-V) Results: CO-dark H2 fraction of ~0.5 Applies to: Solar Neighborhood Caveats: Depends on gamma-ray propagation model (e.g. GALPROP), which in turn depends on a model of the Galaxy. Grenier et. al (2005) Science 307, 1292
CO-Dark H2 : Observations in 2D: Technique: Dust Continuum Reach et al. (1994) ApJ 429,
CO-Dark H2 : Observations in 2D: Technique: Dust Continuum Method: Correlate the dust opacity and N(HI), Xco*Wco, and (Tau/NH) Results: CO-dark H2 fraction of ~1.1 Applies to: Solar Neighborhood Caveats: Unknown Dust properties (temperature, emissivity, etc). Planck Collaboration (2011), A&A, 536, A19
CO-Dark H2 : Observations in 2D: Technique: Dust Extinction Method: Correlate the visual extinction and N(HI), Xco*Wco, and (Av/NH) Results: CO-dark H2 fraction of ~0.6 Applies to: Solar Neighborhood Caveats: Noisy. Paradis et al. (2012) 543, A103
CO-Dark H2 : Observations in 2D: Technique: Dust Continuum Planck Collaboration (2011), A&A, 536, A19
CO-Dark H2 : Observations in “3D”: Technique - 1: [CII] Method: Calculate CII, HI, CO and 13CO azimuthally averaged emissivity. Subtract HI, e-, PDRs, contributions to [CII] intensity. PDRs: [CII] components associated with 13CO emission (large column densities). CNM: HI emission gives HI column density (including an opacity correction), n and T estimated from thermal pressure profile from Wolfire et al. (2003). Ionized gas: Use electron density model of the galaxy from NE2001 model (constrained with pulsars) and T=104K. Pineda et al. 2013 A&A 554, A103
CO-Dark H2 : Observations in “3D”: Technique - 2: [CII] [CII] Emissivity at b=0. Method: Calculate [CII], HI, CO and 13CO azimuthally averaged emissivity. Subtract HI, e-, PDRs, contributions to [CII] intensity. PDRs: [CII] components associated with 13CO emission (large column densities). CNM: HI emission gives HI column density (including an opacity correction), n and T estimated from thermal pressure profile from Wolfire et al. (2003). Ionized gas: Use electron density model of the galaxy from NE2001 model (constrained with pulsars) and T=104K. “PDRs” are exposed to modest FUV fields (1-30 X Draine’s field)
CO-Dark H2 : Observations in “3D”: Technique - 2: [CII] [CII] Luminosity Method: Calculate [CII], HI, CO and 13CO azimuthally averaged emissivity. Subtract HI, e-, PDRs, contributions to [CII] intensity. PDRs: [CII] components associated with 13CO emission (large column densities). CNM: HI emission gives HI column density (including an opacity correction), n and T estimated from thermal pressure profile from Wolfire et al. (2003). Ionized gas: Use electron density model of the galaxy from NE2001 model (constrained with pulsars) and T=104K. FWHM (PDRs, CNM, CO-dark H) = 130 pc FWHM (ELDWIM) = 1000 pc (Kulkarni & Heiles 1987)
CO-Dark H2 : Observations in “3D”: Technique - 1: [CII] Method: Calculate CII, HI, CO and 13CO azimuthally averaged emissivity. Subtract HI, e-, PDRs, contributions to [CII] intensity. • Assumes: • Galactic metallicity gradient (Rolleston et al. 2000). • Pressure gradient from Wolfire et al. 2003 multiplied by a factor 1.5.
CO-Dark H2 : Observations in “3D”: Technique - 1: [CII] Method: Calculate CII, HI, CO and 13CO azimuthally averaged emissivity. Subtract HI, e-, PDRs, contributions to [CII] intensity. Results: Gives the galactic distribution of the CO-dark gas component. Average CO-dark H2 fraction of ~0.3 . Applies to: Entire Galactic plane Caveats: Needs assumptions on the physical conditions (n,T) of the CO-dark H2 layer.
The CO-to-H2 conversion factor (XCO= N(H2)/WCO) • “CO-traced” H2 column density derived from 12CO and 13CO following method in Goldsmith et. al 2008and Pineda et al. 2010 • The XCO gradient follows the metallicity gradient of the Galaxy. • Steeper XCO gradient when CO-dark H2 gas contribution is included. Wilson 1995: XCO=Virial Mass/CO luminosity. Israel 2000: Mass derived from FIR/CO luminosity.
CO-Dark H2 : Observations in “3D”: Technique - 2: [CII] Method: Gaussian decomposition of components along the LOS. 2000 components identified. HI contribution to CII intensity subtracted. Results: CO-dark H2 fraction varies for different types of clouds Applies to: Entire Galactic plane Caveats: Gaussian decomposition is not easy. Needs assumptions on the physical conditions (n,T) of the CO-dark H2 layer. Langer et al. (2013), A&A. submitted. See also: Velusamy et al. (2012), IAU Symposium Langer et al. (2010), A&A. 521, L17 Velusamy et al. (2010), A&A. 521, L18
CO-Dark H2 : Observations in “3D”: Technique - 2: [CII] Method: Gaussian decomposition of components along the LOS. 2000 components identified. HI contribution to CII intensity subtracted. Results: CO-dark H2 fraction varies for different types of clouds Applies to: Entire Galactic plane Caveats: Gaussian decomposition is not easy. Needs assumptions on the physical conditions (n,T) of the CO-dark H2 layer. Langer et al. (2013), A&A. submitted.
Surface Density Distribution of the ISM phases in the Milky Way