Download
1 / 30
300 likes | 312 Views
This talk discusses the use of phylogenetic placement and marker-based taxon identification methods to classify and characterize short reads in a metagenomic sample. It also explores the distribution of species in the sample and how different organisms are interacting.

E N D
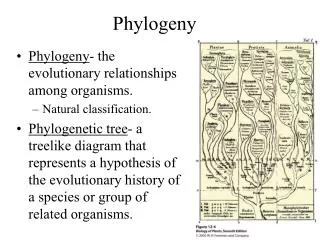
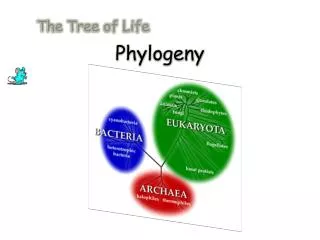
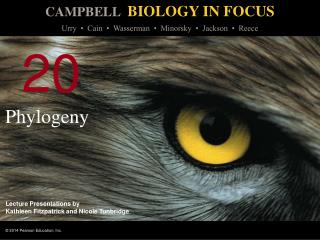
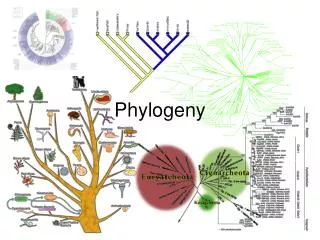
TIPP: Taxon Identification using Phylogeny-Aware Profiles Tandy Warnow Founder Professor of Engineering The University of Illinois at Urbana-Champaign http://tandy.cs.illinois.edu
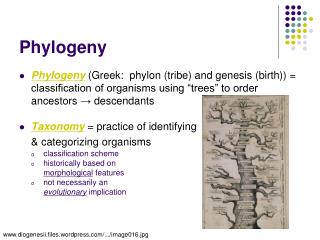
Metagenomic taxonomic identification and phylogenetic profiling Metagenomics, Venter et al., Exploring the Sargasso Sea: Scientists Discover One Million New Genes in Ocean Microbes
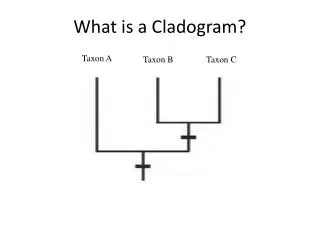
Metagenomic Taxon Identification Objective: classify short reads in a metagenomic sample
1. What is this fragment? (Classify each fragment as well as possible.) 2. What is the taxonomic distribution in the dataset? (Note: helpful to use marker genes.) 3. What are the organisms in this metagenomic sample doing together? Basic Questions
This talk • SEPP (PSB 2012): SATé-enabled Phylogenetic Placement, and Ensembles of HMMs (eHMMs) • Applications of the eHMM technique to metagenomic abundance classification (TIPP, Bioinformatics 2014)
Phylogenetic Placement Input: Backbone alignment and tree on full-length sequences, and a set of homologous querysequences (e.g., reads in a metagenomic sample for the same gene) Output: Placement of query sequences on backbone tree Phylogenetic placement can be used inside a pipeline, after determining the genes for each of the reads in the metagenomic sample.
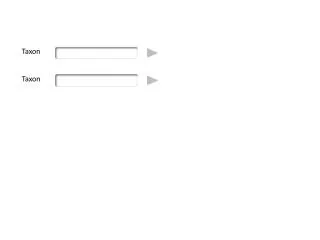
Marker-based Taxon Identification Fragmentary sequences from some gene Full-length sequences for same gene, and an alignment and a tree ACCG CGAG CGG GGCT TAGA GGGGG TCGAG GGCG GGG • . • . • . ACCT AGG...GCAT TAGC...CCA TAGA...CTT AGC...ACA ACT..TAGA..A
Align Sequence S1 = -AGGCTATCACCTGACCTCCA-AA S2 = TAG-CTATCAC--GACCGC--GCA S3 = TAG-CT-------GACCGC--GCT S4 = TAC----TCAC--GACCGACAGCT Q1 = TAAAAC S1 S2 S3 S4
Align Sequence S1 = -AGGCTATCACCTGACCTCCA-AA S2 = TAG-CTATCAC--GACCGC--GCA S3 = TAG-CT-------GACCGC--GCT S4 = TAC----TCAC--GACCGACAGCT Q1 = -------T-A--AAAC-------- S1 S2 S3 S4
Place Sequence S1 = -AGGCTATCACCTGACCTCCA-AA S2 = TAG-CTATCAC--GACCGC--GCA S3 = TAG-CT-------GACCGC--GCT S4 = TAC----TCAC--GACCGACAGCT Q1 = -------T-A--AAAC-------- S1 S2 S3 S4 Q1
Phylogenetic Placement • Align each query sequence to backbone alignment • HMMALIGN (Eddy, Bioinformatics 1998) • PaPaRa (Berger and Stamatakis, Bioinformatics 2011) • Place each query sequence into backbone tree • Pplacer (Matsen et al., BMC Bioinformatics, 2011) • EPA (Berger and Stamatakis, Systematic Biology 2011) Note: pplacer and EPA use maximum likelihood
HMMER vs. PaPaRa Alignments 0.0 Increasing rate of evolution
Or 2 HMMs? HMM 1 HMM 2
Or 4 HMMs? HMM 1 HMM 2 HMM 3 HMM 4
SEPP Parameter Exploration Alignment subset size and placement subset size impact the accuracy, running time, and memory of SEPP 10% rule (subset sizes 10% of backbone) had best overall performance
SEPP (10%-rule) on simulated data 0.0 0.0 Increasing rate of evolution
SEPP and eHMMs An ensemble of HMMs provides a better model of a multiple sequence alignment than a single HMM, and is better able to • detect homology between full length sequences and fragmentary sequences • add fragmentary sequences into an existing alignment especially when there are many indels and/or substitutions.
TIPP: high accuracy taxonomic identification of metagenomic data TIPP: taxon identification using phylogeny-aware profiles (Mirarab et al., Bioinformatics, 2014), marker-based method that only characterizes those reads that map to the marker genes Pipeline that: • Computes UPP/PASTA reference alignments • Uses reference taxonomies • Modifies SEPP by considering statistical uncertaintyin the extended alignment and placement within the tree. • Can be used for taxon identification or abundance profiling • Available in open source form on github
Objective: Distribution of the species (or genera, or families, etc.) within the sample. For example: The distribution of the sample at the species-level is: 50% species A 20% species B 15% species C 14% species D 1% species E Abundance Profiling
TIPP Design • Uses selected marker genes (we show results using Metaphyler’s 30 marker genes, by Mihai Pop and his group), with reference alignments that we compute using UPP/PASTA. • Assigns reads to bins (homologous to marker genes, or unbinned). • For each marker gene, and its associated bin of reads: • Taxonomically characterizes each read in the gene’s bin, by using an eHMM for a reference alignment for the gene, and a reference taxonomy. • This produces a set of placements within the taxonomy, each with statistical support, and allows the user to trade-off sensitivity and specificity. • The outcome is finally one taxonomic characterization (though not necessarily at the species level) for each read. • Pools all the classifications together.
TIPP Design (Step 3) • Input: marker gene reference alignment (computed using PASTA, RECOMB 2014), species taxonomy, and support threshold (typically 95%) • For each marker gene, and its associated bin of reads: • Builds eHMM to represent the MSA • For each read: • Use the eHMM to produce a set of extended MSAs that include the read, sufficient to reach the specified support threshold. • For each extended MSA, use pplacer to place the read into the taxonomy optimizing maximum likelihood and identify all the clades in the tree with sufficiently high likelihood to meet the specified support threshold. (Note – this will be a single clade if the support threshold is at strictly greater than 50%.) • Taxonomically characterize each read at this MRCA.
Objective: Distribution of the species (or genera, or families, etc.) within the sample. Leading techniques: PhymmBL (Brady & Salzberg, Nature Methods 2009) NBC (Rosen, Reichenberger, and Rosenfeld, Bioinformatics 2011) MetaPhyler (Liu et al., BMC Genomics 2011), from the Pop lab at the University of Maryland MetaPhlAn (Segata et al., Nature Methods 2012), from the Huttenhower Lab at Harvard mOTU (Bork et al., Nature Methods 2013) MetaPhyler, MetaPhlAn, and mOTU are marker-based techniques (but use different marker genes). Marker gene are single-copy, universal, and resistant to horizontal transmission. Abundance Profiling
High indel datasets containing known genomes Note: NBC, MetaPhlAn, and MetaPhyler cannot classify any sequences from at least one of the high indel long sequence datasets, and mOTU terminates with an error message on all the high indel datasets.
“Novel” genome datasets Note: mOTU terminates with an error message on the long fragment datasets and high indel datasets.
TIPP vs. other abundance profilers • TIPP is highly accurate, even in the presence of high indel rates and novel genomes, and for both short and long reads. • All other methods have some vulnerability (e.g., mOTU is only accurate for short reads and is impacted by high indel rates). • Improved accuracy is due to the use of eHMMs; single HMMs do not provide the same advantages, especially in the presence of high indel rates.
Comments • Marker-based abundance profiling methods can be more accurate than analyses that classify all the reads. • Improved results possible using: • Better sets of marker genes • Better ways of assigning reads to marker genes • Better taxonomies, or use of estimated gene trees and species trees • Better ways of combining classifications from multiple markers
Publications using eHMMs • S. Mirarab, N. Nguyen, and T. Warnow. "SEPP: SATé-Enabled Phylogenetic Placement." Proceedings of the 2012 Pacific Symposium on Biocomputing (PSB 2012). • N. Nguyen, S. Mirarab, B. Liu, M. Pop, and T. Warnow "TIPP:Taxonomic Identification and Phylogenetic Profiling." Bioinformatics, 2014; http://bioinformatics.oxfordjournals.org/content/early/2014/10/29/bioinformatics.btu721.full.pdf+html • N. Nguyen, S. Mirarab, K. Kumar, and T. Warnow, "Ultra-large alignments using phylogeny aware profiles". Proceedings RECOMB 2015 and Genome Biology (2015) (PDF) SEPP, TIPP, and UPP are all available in open source form on github (smirarab/sepp)
Acknowledgments PhD students: Nam Nguyen (now postdoc at UIUC) and Siavash Mirarab (now faculty at UCSD), and Bo Liu (now at Square) Mihai Pop, University of Maryland NSF grants to TW: DBI:1062335, DEB 0733029, III:AF:1513629 NIH grant to MP: R01-A1-100947 Also: Guggenheim Foundation Fellowship (to TW), Microsoft Research New England (to TW), David Bruton Jr. Centennial Professorship (to TW), Grainger Foundation (to TW), HHMI Predoctoral Fellowship (to SM) TACC, UTCS, and UIUC computational resources