Download
1 / 1
10 likes | 95 Views
P. Webley 3 , B. Stunder 4 3 Geophysical Institute, University of Alaska Fairbanks 4 National Oceanic and Atmospheric Administration. D. Morton 1 , D. Arnold 1,2 , G. Wotawa 2 1 Arctic Region Supercomputing Center 2 Central Institute of Meteorology and Geodynamics of Austria.

E N D
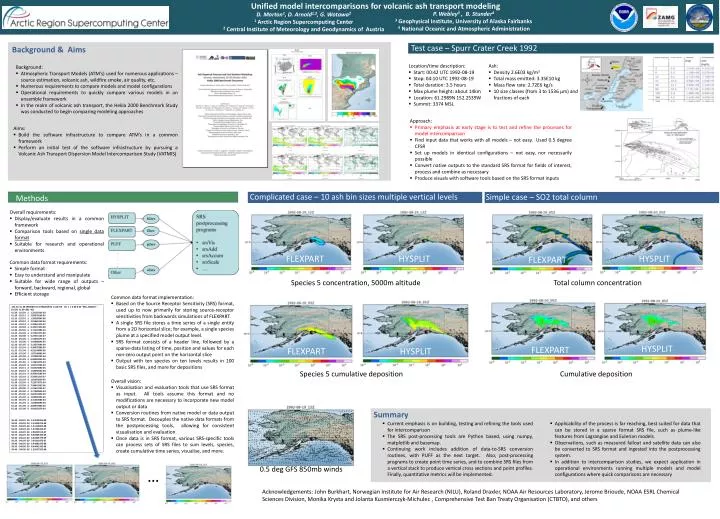
P. Webley3 , B. Stunder4 3 Geophysical Institute, University of Alaska Fairbanks 4 National Oceanic and Atmospheric Administration D. Morton1, D. Arnold1,2, G. Wotawa2 1 Arctic Region Supercomputing Center 2 Central Institute of Meteorology and Geodynamics of Austria Unified model intercomparisons for volcanic ash transport modeling Test case – Spurr Crater Creek 1992 Background & Aims • Location/time description: • Start: 00:42 UTC 1992-08-19 • Stop: 04:10 UTC 1992-08-19 • Total duration: 3.5 hours • Max plume height: about 14km • Location: 61.2989N 152.2539W • Summit: 3374 MSL • Ash: • Density 2.6E03 kg/m3 • Total mass emitted: 3.35E10 kg • Mass flow rate: 2.72E6 kg/s • 10 size classes (from 3 to 1536 μm) and fractions of each • Background: • Atmospheric Transport Models (ATM’s) used for numerous applications – source estimation, volcanic ash, wildfire smoke, air quality, etc. • Numerous requirements to compare models and model configurations • Operational requirements to quickly compare various models in an ensemble framework • In the realm of volcanic ash transport, the Hekla 2000 Benchmark Study was conducted to begin comparing modeling approaches • Approach: • Primary emphasis at early stage is to test and refine the processes for model intercomparison • Find input data that works with all models – not easy. Used 0.5 degree CFSR • Set up models in identical configurations – not easy, nor necessarily possible • Convert native outputs to the standard SRS format for fields of interest, process and combine as necessary • Produce visuals with software tools based on the SRS format inputs • Aims: • Build the software infrastructure to compare ATM’s in a common framework • Perform an initial test of the software infrastructure by pursuing a Volcanic Ash Transport Dispersion Model Intercomparison Study (VATMIS) Complicated case – 10 ash bin sizes multiple vertical levels Simple case – SO2 total column Methods • Overall requirements: • Display/evaluate results in a common framework • Comparison tools based on single data format • Suitable for research and operational environments FLEXPART HYSPLIT HYSPLIT FLEXPART • Common data format requirements: • Simple format • Easy to understand and manipulate • Suitable for wide range of outputs – forward, backward, regional, global • Efficient storage Species 5 concentration, 5000m altitude Total column concentration • Common data format implementation: • Based on the Source Receptor Sensitivity (SRS) format, used up to now primarily for storing source-receptor sensitivities from backwards simulations of FLEXPART. • A single SRS file stores a time series of a single entity from a 2D horizontal slice; for example, a single species plume at a specified model output level. • SRS format consists of a header line, followed by a sparse-data listing of time, position and values for each non-zero output point on the horizontal slice • Output with ten species on ten levels results in 100 basic SRS files, and more for depositions -152.20 61.30 19920819 01 19920819 04 1.51E+09 28 1 1 0.05 0.05 "ERU_000001" -172.00 51.00 801 401 61.30 -152.20 -1 1.2515556E-03 61.30 -152.15 -1 2.9597816E-05 61.25 -152.10 -1 1.5828934E-06 61.30 -152.10 -1 4.0168912E-04 61.35 -152.10 -1 5.2936131E-07 61.25 -152.05 -1 6.3315735E-06 61.30 -152.05 -1 3.7156198E-04 61.35 -152.05 -1 3.1761677E-06 61.25 -152.00 -1 5.2763112E-07 61.30 -152.00 -1 1.3160457E-04 61.35 -152.00 -1 2.6468064E-05 61.30 -151.95 -1 2.1352709E-04 61.35 -151.95 -1 4.3407628E-05 61.25 -151.90 -1 4.2210490E-06 61.30 -151.90 -1 1.8710048E-04 61.35 -151.90 -1 1.0798970E-04 61.25 -151.85 -1 6.8592045E-06 61.30 -151.85 -1 1.1363447E-04 61.30 -152.20 -2 1.6310129E-03 61.30 -152.15 -2 5.6552968E-05 61.25 -152.10 -2 1.5828934E-06 61.30 -152.10 -2 8.5042458E-04 61.35 -152.10 -2 5.2936131E-07 61.25 -152.05 -2 1.6356565E-05 61.30 -152.05 -2 7.2357357E-04 61.35 -152.05 -2 7.9404195E-06 61.25 -152.00 -2 5.2763112E-07 61.30 -152.00 -2 2.7748083E-04 61.35 -152.00 -2 4.6054432E-05 61.25 -151.95 -2 1.5828934E-06 61.30 -151.95 -2 4.3128768E-04 61.35 -151.95 -2 1.0269609E-04 61.25 -151.90 -2 8.9697290E-06 61.30 -151.90 -2 3.6416237E-04 . . . 58.45 -140.25 -20 2.3205586E-08 58.00 -140.20 -20 4.1932391E-08 58.05 -140.20 -20 1.4141680E-08 58.25 -140.20 -20 1.0378249E-07 58.30 -140.20 -20 2.0035761E-07 58.35 -140.20 -20 8.4692336E-08 58.40 -140.20 -20 3.0320337E-09 58.35 -140.05 -20 3.4031187E-07 58.40 -140.05 -20 6.4408187E-08 58.35 -140.00 -20 6.6404133E-08 58.40 -140.00 -20 1.2567795E-08 HYSPLIT FLEXPART HYSPLIT FLEXPART Species 5 cumulative deposition Cumulative deposition • Overall vision: • Visualisation and evaluation tools that use SRS format as input. All tools assume this format and no modifications are necessary to incorporate new model output or data • Conversion routines from native model or data output to SRS format. Decouples the native data formats from the postprocessing tools, allowing for consistent visualisation and evaluation. • Once data is in SRS format, various SRS-specific tools can process sets of SRS files to sum levels, species, create cumulative time series, visualise, and more. Summary • Current emphasis is on building, testing and refining the tools used for intercomparison • The SRS post-processing tools are Python based, using numpy, matplotlib and basemap. • Continuing work includes addition of data-to-SRS conversion routines, with PUFF as the next target. Also, post-processing programs to create point time series, and to combine SRS files from a vertical stack to produce vertical cross sections and point profiles. Finally, quantitative metrics will be implemented. • Applicability of the process is far reaching, best suited for data that can be stored in a sparse format SRS file, such as plume-like features from Lagrangian and Eulerian models. • Observations, such as measured fallout and satellite data can also be converted to SRS format and ingested into the postprocessing system. • In addition to intercomparison studies, we expect application in operational environments running multiple models and model configurations where quick comparisons are necessary 0.5 deg GFS 850mb winds … Acknowledgements: John Burkhart, Norwegian Institute for Air Research (NILU), Roland Draxler, NOAA Air Resources Laboratory, Jerome Brioude, NOAA ESRL Chemical Sciences Division, Monika Krysta and JolantaKusmierczyk-Michulec , Comprehensive Test Ban Treaty Organisation (CTBTO), and others