Download
1 / 22
220 likes | 360 Views
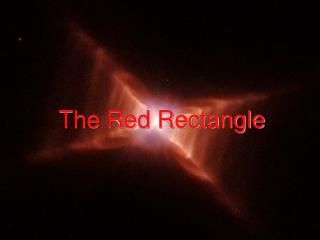
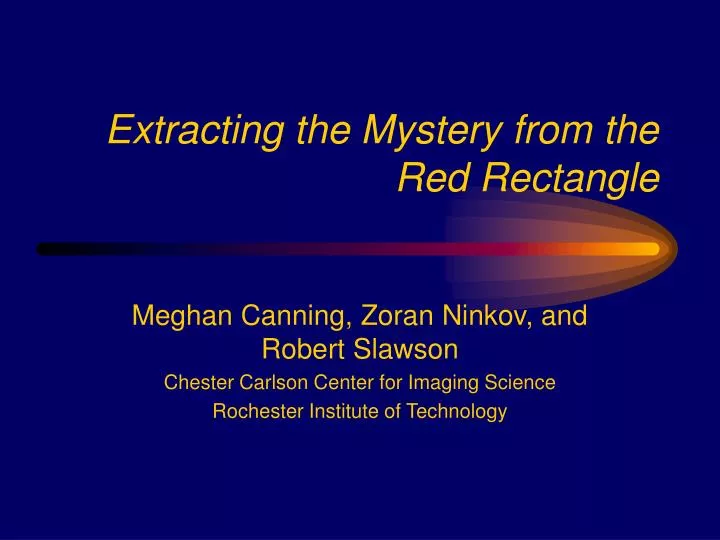
Extracting the Mystery from the Red Rectangle. Meghan Canning, Zoran Ninkov, and Robert Slawson Chester Carlson Center for Imaging Science Rochester Institute of Technology. Overview. Research Objectives Background Methodology Progress To Date Further Investigation Conclusions.

E N D
Extracting the Mystery from the Red Rectangle Meghan Canning, Zoran Ninkov, and Robert Slawson Chester Carlson Center for Imaging Science Rochester Institute of Technology
Overview • Research Objectives • Background • Methodology • Progress To Date • Further Investigation • Conclusions
Objectives • Short Term • To Accurately Model and Remove Stellar Objects from Spectrophotometric Images of Emission Nebula by Way of Profile Fitting • Long Term • To Characterize the Extended Emission Present in the “Red Rectangle”
Emission Nebula • Red Rectangle • Star HD44179 • Biconical nebula • X-shaped pattern in red region of visible spectrum
Optical Spectroscopy Emission Nebula
Methodology • Acquire spectrophotometric images of Red Rectangle • Fit a point spread function to nebula’s central star at reference wavelength (525 nm) • Remove profile from images corresponding to spectral emission lines of interest
Image Acquisition • UTSO 60 cm telescope • Front-illuminated Kodak KAF-4200 CCD inside Photometrics CH-250 camera head
Image Acquisition • Cambridge Research & Instrumentation, Inc. Varispec Tunable Liquid Crystal Filter • Fixed spectral bandwidth of 10 nm • Central wavelength tunable between 400 and 700 nm • 31% transmittance at 700nm; 5% at 435nm
Spectral Characteristics Image 2 - 638 nm Image 1 - 525 nm Exposure time = 800 sec Exposure time = 400 sec
Methodology • Find coordinates of peak intensity of like objects in Image 1 & Image 2 • Calculate scaling with respect to intensity of Red Rectangle in Image 1 • Fit appropriately scaled PSF • Subtract profile from coordinates of peak intensity
Processing • Image Reduction Analysis Facility • DAOPHOT package (NOAO/Tuscon) • DAOFIND - locates coordinates of peak intensity • PHOT - calculates photometry parameters • PSF - Fits a point spread function • ALLSTAR - Removes psf from stellar objects
Object Red Rectangle 525nm Faint Star 525nm Red Rectangle 638nm Peak Intensity PSF Scale Factor 6279.226 1.0000 2602.09 1.2430 7837.154 0.4144 Photometry Parameters
Imaging • Fit Gaussian Profile at 525 nm • FWHM = 10 pixels • PSF radius = 37 pixels Pixel Value Column (pixels)
Profile Testing • Does the psf accurately model the central star at 525 nm? • Can the psf be accurately scaled to fit other stellar objects: • within the 525 nm frame? • in frames recorded at 638 nm?
PSF Removal - Central Star =525 nm Pixel Value Column (pixels)
PSF Removal - Faint Star =525 nm Pixel Value Column (pixels)
PSF Removal - Red Rectangle • Reconstructed Image of Nebulosity at = 638 nm
Red Rectangle - 638 nm Pixel Value Pixel Value Column (pixels) Red Rectangle -Reconstructed Column (pixels)
Analysis • Virtually Faultless Removal of psf from central star in Image 1 • Only Poisson noise from fit remaining • Removal of psf from faint stellar object in Image 1 results in a small peak intensity (~250) surrounded by a negative “dip”
Analysis • PSF is not good enough • Fit is too small at the peak intensity; too bright in the wings • May be some emission at 525 nm causing an inaccurate fit to the central star • Consequently -extended emission at 638 nm is inadequately reconstructed
Further Investigation • Fit psf to an average profile taken from several stars in Image 1 • Small FOV - OTF constant over frame • Apply profile testing methods • Verify registration/centering accuracy
Conclusions • Many variables involved in psf fitting • Encouraging Beginning • Further testing of psf accuracy and centering algorithms must be completed before success in generating a representation of the extended emission can be achieved