Download
1 / 38
460 likes | 1.05k Views
Realized Genomic Relationships and Genomic BLUP . Fikret Isik Associate Professor. Cooperative Tree Improvement Program North Carolina State University, Raleigh, USA. Outline. Background Realized genomic relationships G matrix H matrix Genomic BLUP

E N D
Realized Genomic Relationships and Genomic BLUP Fikret Isik Associate Professor Cooperative Tree Improvement Program North Carolina State University, Raleigh, USA Genomic BLUP - UofCopenhagen
Outline • Background • Realized genomic relationships • G matrix • H matrix • Genomic BLUP • Empirical Examples from PinustaedaL. Genomic BLUP - UofCopenhagen
Expected covariances • Additive genetic relationships (covariances) derived from a pedigree are based on probabilities that gene pairs are identical by descent (IBD) • For example, the average genetic covariance between full-sibs is 0.5 because full-sibs are expected to share 50% of their genome that is IBD Genomic BLUP - UofCopenhagen
Genetic merit • In the classic “infinitesimal model” of quantitative genetics, breeding value is considered to be the sum of thousands of allelic effects. Genomic BLUP - UofCopenhagen
Traditional genetic evaluation • Infinitesimal model has been very successful to predict genetic merit of individuals in animal- and plant-improvement programs • This model does not trace individual alleles (black box) (VanRaden 2008). Genomic BLUP - UofCopenhagen
Tracing loci • “Remember that all models are wrong; the practical question is how wrong do they have to be to not be useful” George Box. • In real genomes, those alleles are physically located at loci whose transmission can be traced through genetic markers. Genomic BLUP - UofCopenhagen
The real deficiency of model • Genetic relationships derived from pedigree ignore the random sampling of the two possible alleles from each parent at each locus during meiosis (Avendano et al. 2005). • In the absence of phenotype, selection is not possible in a cross. Genomic BLUP - UofCopenhagen
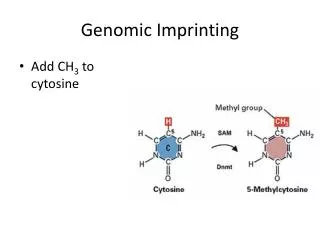
Mendelian segregation effect (m) • When gametes are produced (by meiosis) allele pairs segregate, leaving each cell with a single allele (Mendel’s law of segregation). • Each progeny receives 50% of parental DNA, random sampling of parent alleles at each locus during meiosis • The genetic merit: 0.5 (uj + uk) + miwherej, k are parents of i Genomic BLUP - UofCopenhagen
Genetic similarities • van Arendonk et al. (1994) suggested that large numbers of DNA markers covering the genome could measure genetic similarity more accurately than a pedigree-based relationship • because the genetic covariances would be based on the actual proportion of the genome that is IBD between any two individuals. Genomic BLUP - UofCopenhagen
Realized genomic relationships • Genetic markers could estimate proportion of chromosome segments shared by individuals including identification of genes IBS (VanRaden, 2008) Genomic BLUP - UofCopenhagen
Genomic predictions • Selection based on realized genomic relationships can produce more accurate predictions than the pedigree-based method • because genomic selection can exploit variation created by Mendelian segregation during gamete formation (Goddard and Hayes 2007) Genomic BLUP - UofCopenhagen
Genomic predictions (cont.) • Such methods do not require known location of markers in the genome or • do not require estimation of relative effects of individual QTL on the trait. Genomic BLUP - UofCopenhagen
Matrix of gene content (M) The product of M matrix with its transpose M´ is MM’ matrix individual 1 individual 2 individual 3 • Diagonal: Counts the # of homozygous loci for each individual. • Off-diagonal: Measure the number of alleles shared by relatives (VanRaden, 2008, Forni et al. 2011) Genomic BLUP - UofCopenhagen
Realized genomic relations matrix ZZ’ = (M – P) (M – P)’ • Dividing by scales G to be analogues to the A matrix • p_i are the observed MAF of all genotyped individuals regardless of inbreeding and selection (VanRaden 2008) Genomic BLUP - UofCopenhagen
Assumptions of GS • QTL explaining genetic variation are in LD with genetic markers (Meuwissen et al. 2001). • We do not know the frequency of alleles IBS are actually are IBD, especially in outbred populations (Legarra et al. 2009). Genomic BLUP - UofCopenhagen
Inverse of G matrix • The genomic matrix is positive semidefinite but it can be singular (no unique solution) if • Number of loci is limited • Subjects have identical genotypes across all loci • Number of markers is smaller than the number of individuals genotyped Genomic BLUP - UofCopenhagen
Inverse of G matrix • To avoid potential problems G can be weighted • Gr is unweighted genomic matrix • A is numerator relationship matrix among only genotyped animals • w is weight - This value is not critical between values of 0.95 and 0.98 (Aguilar et al. 2010) Genomic BLUP - UofCopenhagen
Hybrid genetic relationship matrices • Genotyping may not be reasonable for all the population due to high cost and logistic limitations, particularly for tree breeding populations. Genomic BLUP - UofCopenhagen
Hybrid genetic relationships • vanRaden and (2008) and Legarraet al. (2009) proposed combining numerator relationships matrix (A) derived from pedigree with the genomic relationship matrix (G) into a single matrix (H = A+G ) to use in predictions. Genomic BLUP - UofCopenhagen
A modified animal model • In H matrix, genomic information is transmitted to the covariances among all non-genotyped individuals (Legarra et al. 2009). • The H matrix is a joint distribution of genotyped and non-genotyped genetic values Genomic BLUP - UofCopenhagen
Construction of H matrix • Instead of A-1, genomic analysis uses • is contribution of genomic relationships in H A22for the genotyped individuals Misztal et al. 2009, VanRaden 2008 Genomic BLUP - UofCopenhagen
Predictions of genetic merit of trees using G and H matrices Genomic BLUP - UofCopenhagen
Genomic BLUP Genomic estimated breeding values using selection index equations Markers effects can be estimated by substituting the Z’ to the leftmost G Genomic BLUP - UofCopenhagen
Mixed models for GBLUP y = Xb + Zu + e • Xb is the mean (other fixed effects could be added) • Z is incidence matrix for marker effects • u is vector of additive genetics effects that correspond to allele substitution effects for each marker • We let the sum Zu across all marker loci (m) to be equal to the vector of breeding values Za = u (VanRaden 2008) Genomic BLUP - UofCopenhagen
Mixed model equations for GBLUP Lambda is defined as the sum across loci 2Σpi1-pi times the ratio of error and additive genetic variance Genomic BLUP - UofCopenhagen
Empricalresults from PinustaedaL. Genomic BLUP - UofCopenhagen
Pedigree-based relationships for 305 progeny, from 9 families mean = 0.54 min = 0.41 max = 0.62 N = 3,998 Genomic BLUP - UofCopenhagen
Genomic relationships for 165 trees, from 9 families mean = 0.53 min = 0 max = 0.95 N = 1,967 Genomic BLUP - UofCopenhagen
Predictions from ABLUP-GBLUP Zapata-Valenzuela et al. 2013 Genomic BLUP - UofCopenhagen
Accuracies of the predictions Accuracies of predictions from markers (GBLUP) are higher than accuracies of predictions from pedigree based models (ABLUP) Zapata-Valenzuela et al. 2013 Genes Genomes Genetics. Genomic BLUP - UofCopenhagen
Markers are capturing the Mendelian sampling effect Zapata-Valenzuela et al. 2013 Genes Genomes Genetics. Genomic BLUP - UofCopenhagen
FundaOgut, (NCSU Crop science) Manuscript in preparation Predictions from blended genomic relationship in Pinustaeda Genomic BLUP - UofCopenhagen
Actual data(Mid-parent EBVs) ABLUP: Predictions of full-sib progeny within nine families. No phenotype was available and predictions are mid-parent breeding values Genomic BLUP - UofCopenhagen
Actual data(Mid-parent EBVs) ABLUP: Predictions of full-sib progeny within nine families Not much segregation within a cross Genomic BLUP - UofCopenhagen
Actual data-TBVs and EBVs Dark blue dots: Non-genotyped Red dots: predictions from HBLUP HBLUP r=0.73 HBLUP models captures Mendelian segregation effect (different BV) within full-sib crosses. Genomic BLUP - UofCopenhagen
Summary • Realized genomic relationships allow capturing the Mendelian sampling effect for within-family (forward) selection without phenotype • An important advantage to control inbreeding and increase genetic gain across multiple generations in forest tree breeding compared to the traditional evaluation Genomic BLUP - UofCopenhagen
Summary (cont.) • HBLUP uses all the available genomic, pedigree and phenotype information in one step for genomic predictions • Implementation is straightforward • Standard software available for linear mixed models can be used to solve for mixed model equations while accounting for experimental design factors, such as location and age Genomic BLUP - UofCopenhagen