Download
1 / 36
360 likes | 471 Views
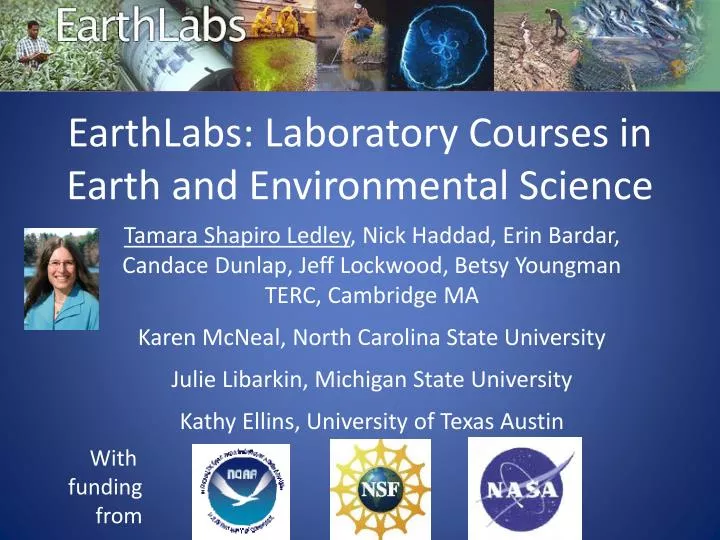
EarthLabs : Laboratory Courses in Earth and Environmental Science. Tamara Shapiro Ledley , Nick Haddad, Erin Bardar , Candace Dunlap, Jeff Lockwood, Betsy Youngman TERC, Cambridge MA Karen McNeal, North Carolina State University

E N D
EarthLabs: Laboratory Courses in Earth and Environmental Science Tamara Shapiro Ledley, Nick Haddad, Erin Bardar, Candace Dunlap, Jeff Lockwood, Betsy Youngman TERC, Cambridge MA Karen McNeal, North Carolina State University Julie Libarkin, Michigan State University Kathy Ellins, University of Texas Austin With funding from
Educational Resources AddressingClimate Science and Earth System Science • Climate Literacy and Energy Awareness Network (CLEAN) • http://cleanet.org • Earth Exploration Toolbook • http://serc.carleton.edu/eet • EarthLabs • Teachers Guide http://serc.carleton.edu/earthlabs • Student Guide • http://serc.carleton.edu/eslabs
Climate Literacy and Energy Awareness Network (CLEAN)http://cleanet.org • >610 climate and energy educational resources • Activities, videos, visualizations • Grades 6-16 • Reviewed for scientific accuracy, pedagogical effectiveness, and technical quality by 5-7 scientists and educators • Collection of educational resources in the Teaching Climate section of Climate.gov - www.climate.gov/teaching • Won 2014 Webby and People’s Choice award in Green Category Gold et.al, Journal of Geoscience Education, 2012
TheEET isa collection of computer based activities that feature Earth science datasets and data analysis tools. EETchapters provide step-by-step instructions for accessing and analyzing data to explore issues or concepts in Earth system science. 44 EET chapters Ledley et al, Science, 2011 The Earth Exploration Toolbook (EET) http://serc.carleton.edu/eet
EarthLabs Climate Moduleshttp://serc.carleton.edu/earthlabs/index.html Project Components Curriculum Development Professional Development Educational Research on Student Learning Ellins et al, Journal of Geoscience Education, in press McNeal et al, Journal of Geoscience Education, in press
9 Modules comprised of 5-9 labs each in Earth science • Modules illustrate sequences for learning science concepts through data analysis and hands-on experiments. • Use satellite imagery, numerical data, and computer visualization software to explore Earth system processes • Include the use and development of quantitative skills that enable students to evaluate scientific results for themselves.
• Time requirement: 12 – 14 hours • Each module uses a variety of instructional strategies - readings - videos, animations - interactive visualizations - hands-on lab investigations - data analysis - classroom discussions http://serc.carleton.edu/earthlabs/index.html
EarthLabs website has 2 Parts Teacher Side: http://serc.carleton.edu/earthlabs Student Side: http://serc.carleton.edu/eslabs
EarthLabs Climate Introduction http://serc.carleton.edu/earthlabs/climate_intro/index.html
Lab Overviewshttp://serc.carleton.edu/earthlabs/cryosphere/lab_overviews.html
Explore the Climate and the Cryosphere Module • Key Questions • What is the cryosphere? • How and why does the cryosphere change over time? • What are the timescales associated with changes in the cryosphere? • How do climate and the cryosphere influence each other? http://serc.carleton.edu/earthlabs/cryosphere/index.html
Explore the Climate and the Cryosphere Module • Teachers Guide • http://serc.carleton.edu/earthlabs/cryosphere/1.html • Student Portal • http://serc.carleton.edu/eslabs/cryosphere/index.html • Lab Overviews • The Cryosphere Labs • Getting to Know the Cryosphere • Earth’s Frozen Oceans • Land Ice • Climate History and the Cryosphere • Evidence of Recent Change • Future of the Cryosphere • Cryosphere Glossary
EarthLabs - Cryosphere • Getting to Know the Cryosphere • What are the components of the cryosphere • How climate and the cryosphere influence each other • Earth’s Frozen Oceans • How does sea ice form and how it influences ocean currents • How does sea ice thickness change over time • Land Ice • How do glaciers form • How do glaciers move
EarthLabs - Cryosphere • Climate History and the Cryosphere • Land ice • Processes and timescales involved in glaciation • How do scientists study glaciers • How temperture, glaciers, coastlines and sea level changed over the past 450,000 years • Evidence of Recent Change • Examine how land glaciers and sea ice have changed over the recent past • Future of the Cryosphere • Contemplate how climate will change in the future based on model results • Contemplate how changes in glaciers will contribute to sea level rise
Cognitive Challenges to Understanding Climate Change • Earth System Science • Understanding the interconnectedness of all of the components of the system • Changes in one component can have large and unanticipated impacts on other components • Change Over Time on Multiple and Embedded Time Scales • Daily, seasonal, annual, interannual, decadal, century, glacial, geologic… • Long-term change manifested as impact on shorter cycles
EarthLabs Educational Research • • How does the on-line EarthLabs curriculum assist students in developing understanding of temporal and spatial dynamics, system interactions, and conceptual knowledge of climate? • How do users engage with and navigate the on-line EarthLabs curriculum?
Populations & Methods http://www.uxmatters.com/mt/archives/2005/12/introduction-to-eyetracking-seeing-through-your-users-eyes.php http://gettingsmart.com/cms/edreformer/new-report-highlights-real-teacher-retention-crisis-america/ http://www.mnsu.edu/newstudent/seminar/
Example open-ended CryosphereEarthLabs pre-post assessment Hemisphere warms Ice melts Student response: “The hemisphere is warming, causing ice to melt.” 9
Expert response: “The images show the sea ice extent through the seasonal cycle. In the winter the sea ice extent would be the greatest. This is because there is no or little solar radiation over the region at that time of the year, causing air temperatures to be very low, resulting in a growth and expansion of sea ice at the surface of the ocean… The image for day 180 shows the sea ice extent reduced from the image for day 90 so that image shows the sea ice extent in the spring.” Sunlight Solar Radiation is present drops / is low Air temps rise Air temps 36 Ice temps drop reach melting Sea ice Ice grows melts
Pre-post student response rubric scores “Explain in your own words why the ice extent of these images is different” Pre-post p <0.05
“The following diagram represents a region in the continental United States. Draw in and label arrows to represent ALL of the important processes that move or change energy, water, or chemicals in this region”.
Systems Understanding Pre Expert = 34 Teacher Expert Score Pre Post Post Number of Arrows Drawn Expert = 10 Teacher Score Pre Post
Please describe and define The Cryosphere in your own words Systems Understanding Student Example Pre: “I don’t know, sorry.” Post: “The sphere with ice, snow, sleet, etc.” Pre-instruction = 42% “I don’t know” Post-instruction = 18% “I don’t know” Pre Post Pre-instruction = 33% “ice” Post-instruction = 57% “ice” Paired Student’s t-test p < 0.05 N = 163
Please describe and define Earth system science in your own words Conceptual Understanding Student Example Pre: “The research of the way that the Earth operates. This show us how the earth is changing as a whole.” Teacher Score Post: “The work of geography such as biosphere, pedosphere, atmosphere, and hydrosphere used to find information and solve facts for future use and help us find out more about the way our planet works” Pre Post Paired Student’s t-test p < 0.05 N = 163
Methods: Eye-tracking studies • Pre-Study Measures • Color-blindness • Climate change conceptions • Demographics
Time to complete - 23 and 32 minutes • engaged less with images than with text • difficulty engaging with some materials posted on external sites
Purple path is a participant with significant attention. Blue path is cursory and is typical of most participants.
Students had difficulty knowing where to look on complex scientific graphs/figures
Conclusions • Students’ SYSTEMS UNDERSTANDING and CONCEPTUAL UNDERSTANDsignificantly improved after exposure to EarthLabs modules, although students did not reach mastery levels on par with expert responses. • Classroom observations combined with eye-tracking measures of external users indicate that the EarthLabs modules were ENGAGING TO USERS. • The EarthLabsCURRICULUM-RESEARCHmodel is an example of how research can be used to inform curriculum development.
Educational Resources AddressingClimate Science and Earth System Science • Climate Literacy and Energy Awareness Network (CLEAN) • http://cleanet.org • Earth Exploration Toolbook • http://serc.carleton.edu/eet • EarthLabs • Teachers Guide http://serc.carleton.edu/earthlabs • Student Guide • http://serc.carleton.edu/eslabs CONTACT: Tamara Shapiro Ledley, Tamara_Ledley@terc.edu, 617-873-9658