Download
1 / 50
500 likes | 654 Views
Broulim’s Artisan Bread and Tortilla Survey Results. Caitlin Trani , Chantelle Rowley, Kristi Keister , Kyle Manning, Christian Holman. {Table of contents}. Research Objectives: 3 Methodology: 4-5 Limitations: 6 Demographics: 7-11 Perceptions of Bread & Bakery: 12-16

E N D
Broulim’s Artisan Bread and Tortilla Survey Results Caitlin Trani, Chantelle Rowley, Kristi Keister, Kyle Manning, Christian Holman
{Table of contents} • Research Objectives: 3 • Methodology: 4-5 • Limitations: 6 • Demographics: 7-11 • Perceptions of Bread & Bakery: 12-16 • Awareness & Purchase Habits: 17-26 • Willingness to Purchase: 27-35 • Tortillas: 35-50
{Research Objectives} • Artisan Bread • Awareness/Usage • Pricing Expectations • Reasons would not purchase • Broulim’s Bakery Atmosphere • Tortillas • Tortilla purchase habits • Likelihood to buy fresh tortillas made in store • Pricing expectation
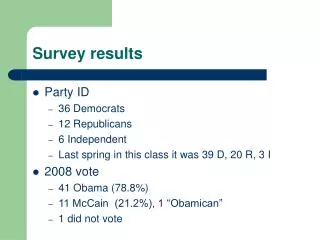
{Methodology} • 1,266 email invitations sent • Survey ran for 10 days • Reminders sent 5 days into survey to non-responders • 433 people started survey, 412 finished. • 24screened out • Net sample 388 • *All results are significant at a 95% confidence level
{Methodology} Broulim’s Sample • 57 Finished • 62 Started • 92% completion Rate • 268 invited • 23% Response Rate Employee Sample • 106 Finished • 108 Started • 98% completion rate • 248 invited Student Sample: • 249 Finished • 263 Started • 95% completion rate • 750 invited • 35% response rate
{Limitations} • Sampling due to Broulim’s regular customers • Apathy of respondents • The wording on some questions could be confusing • The arrangement of questions could be misleading
{Perceptions of Bakery} 1 - Strongly Disagree 2 - Disagree 3 - Neither Agree Nor Disagree 4 - Agree 5 - Strongly Agree
{Broulim’s Bakery Perceptions} Interesting Find – Responses of “Not sure/Can’t Remember” • Needs More lighting/too dark = 17% • Too Cluttered/hard to navigate = 12% • Colors are drab and unappealing = 13% • Display Units are drab and unappealing = 12% • Has Appetizing odors = 10%
{Recommendations} • There is an opportunity to create an experience that leaves an impression on customers • Remodel is an opportunity to innovate • Customers did seem to feel that the bakery has an appetizing odor. • Find a way to use this as an advantage in creating an experience • Create an experience • Packaging, interaction
{Recommendation} • The data shows that there is a large market to capture with students and those up to the age of 25. • Starving Student Cards, Rexburg Savings • Update Website • Use social media - Facebook
{Recommendations} • Promote the great price
{Flour Tortilla Preferred by Mountain West vs. Everywhere Else}
{Recommendation} • Flour Tortillas • Flavored tortillas should be targeted toward women • Flavor varieties in the morning for earlier shoppers
{Recommendations} • Pricing – 60 cents more than a comparable 10 pack tortilla • Target women – higher favorable preferences for atmosphere, ingredients and taste • Get a good recipe – make sure it’s tested and comparable to other fresh tortillas