Download
1 / 21
220 likes | 390 Views
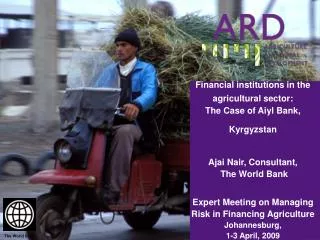
INCLUSIVE GREENGROWTH. The Pathway to Sustainable Development. Marianne Fay, The World Bank , June 2012. Sustainable development requires greener growth. Continued and more inclusive growth is needed. GDP per capita still very low in developing countries: 1990: $1,200 2010: $2,300

E N D
INCLUSIVE GREENGROWTH The Pathway to Sustainable Development Marianne Fay, The World Bank, June 2012
Continued and more inclusive growth is needed • GDP per capita still very low in developing countries: 1990: $1,200 2010: $2,300 2030: $4,700* • 918 million people still expected to live in poverty by 2015 *: in $2010, using WB growth projections
But growth has come at a heavy environmental price Climate Change Ocean acidification Chemical pollution (not yet quantified) Stratospheric ozone depletion Atmospheric aerosol loading (not yet quantified) ? ? Nitrogen cycle (biogeochemical flow) Biodiversity loss Phosphorus cycle Global freshwater use Change in land use Source: Rockström et al., Nature (2009)
Green growth is… …economic growth that is environmentally sustainable. Not a new paradigm, but aims to operationalize sustainable development by enabling developing countries to achieve robust growth without locking themselves into unsustainable patterns. Not inherently inclusive, hence the need for specific policies to ensure the poor benefit.
Is it possible? Can we green growth without necessarily slowing it?
Manage the environment as “natural capital” Y = f (A, K, L, E) Y = f (A, K, L)
Manage the environment as “natural capital” • Loess plateau- after Loess plateau- before
And how to measure progress? Inclusive Growth that is efficient, clean, and resilient
Challenges • Cultural: moving beyond GDP • Theoretical: capturing sustainability in a single indicator • Policy: designing indicators that are useful • Practical: data, data, data…
economic growth GDP p.c.
shared prosperity • income growth of the bottom 40% • poverty eradication • no of people below $1.25 poverty line + inclusiveness • economic growth • GDP p.c.
+ • shared prosperity • income growth of the bottom 40% • poverty eradication • no of people below $1.25 poverty line inclusiveness • economic growth • GDP p.c. sustainability
Calculating Change in Wealth per capita Data for Cameroon, 2008
Source: World Bank calculations based on World Bank data, 2013.
+ • shared prosperity • income growth of the bottom 40% • poverty eradication • no of people below $1.25 poverty line inclusiveness • economic growth • GDP p.c. • resource efficiency • energy intensity • water productivity • green multi-factor productivity sustainability
+ • shared prosperity • income growth of the bottom 40% • poverty eradication • no of people below $1.25 poverty line inclusiveness • economic growth • GDP p.c. • resource efficiency • energy intensity • water productivity • green multi-factor productivity • economic resilience • risk (hazard x exposure x sensitivity) • response (recovery, transformability) sustainability
+ • shared prosperity • income growth of the bottom 40% • poverty eradication • no of people below $1.25 poverty line inclusiveness • economic growth • GDP p.c. • resource efficiency • energy intensity • water productivity • green multi-factor productivity • economic resilience • risk (hazard x exposure x sensitivity) • response (recovery, transformability) sustainability enabling conditions