Download
1 / 16
160 likes | 175 Views
Explore the importance of air pollution monitors in complying with EPA standards, alerting communities of immediate risks, and providing valuable data to scientists. Discover the TCEQ monitoring system, its 212 monitors in Texas (63 in Houston/Galveston region), and its measurement of meteorological conditions and pollutant concentrations including NOx, ozone, PM2.5, and CO2. Visualize pollutant concentrations, compare Houston to Austin, discuss sources of pollution, and determine where more monitors are needed.

E N D
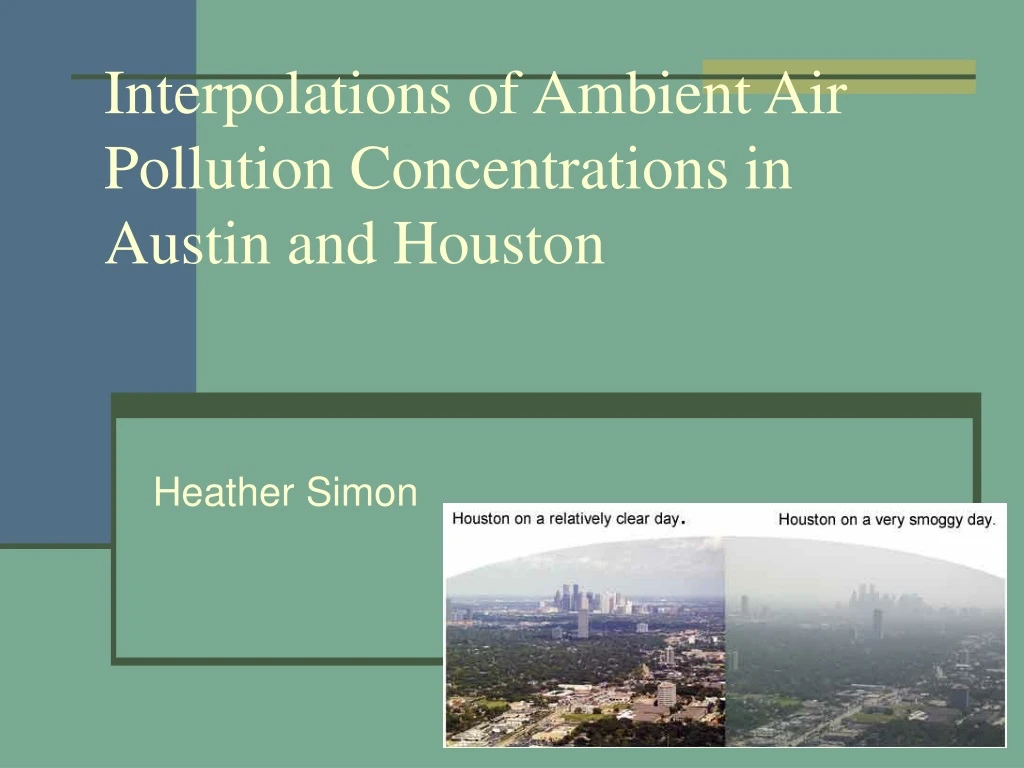
Interpolations of Ambient Air Pollution Concentrations in Austin and Houston Heather Simon
Importance of Air Pollution Monitors • Show compliance with EPA standards • Alert communities if pollutant concentrations reach a level that poses an immediate risk • Provide valuable data to scientists studying air pollution chemistry
TCEQ Monitoring System • 212 monitors in Texas • 63 monitors in Houston/Galveston region • Measure meteorological conditions • Wind speed • Wind direction • Solar flux • Temperature • Measure pollutant concentrations • NOx • ozone • PM2.5 • CO • SO2
Objectives • Map pollutant concentrations for a specific air pollution episode (June 2, 2005) • Show where pollution concentrations are good/moderate/dangerous • Compare Houston to Austin • Discuss sources of pollution • Interpolate pollution data to visualize concentrations in areas other than at monitoring locations • Determine where more monitors are most needed • Locations of highest uncertainty • Locations where high uncertainties overlap for multiple pollutants • Locations where air quality is bad
images of all the layers that were imported. Imported Data Layers
Wind Data TCEQ emissions plume animation
Conclusions • Ozone did reach levels of concern in Houston • Mapping and interpolation allowed us to see a clear spatial trend in ozone concentrations • Wind data showed that most ozone in Houston originated from the industrial areas, not the urban core • Based on uncertainty in ozone interpolations, monitors should be placed to the north and southwest of the city • Since ozone concentrations are low to the southwest, first priority should be put on the northern monitors • Note of caution: conclusions drawn from a single day of data may not be universally applicable
Data Sources • County, city, urban area, highway, and monitoring point layers were obtained from the Texas Natural Resource Information System. http://www.tnris.state.tx.us/DigitalData/data_cat.htm • Pollutant concentrations and meteorological data were obtained from the Texas Commission on Environmental Quality. http://www.tceq.state.tx.us/cgi-bin/compliance/monops/daily_summary • Air Trajectories were obtained from the National Oceanographic and Atmospheric Administration. http://www.arl.noaa.gov/ready/open/hysplit4.html • Air Quality Index information was obtained from the United States Environmental Protection Agency. http://airnow.gov/index.cfm?action=static.publications
Acknowledgements • Dr. Maidment • GIS classmates