Download
1 / 28
280 likes | 295 Views
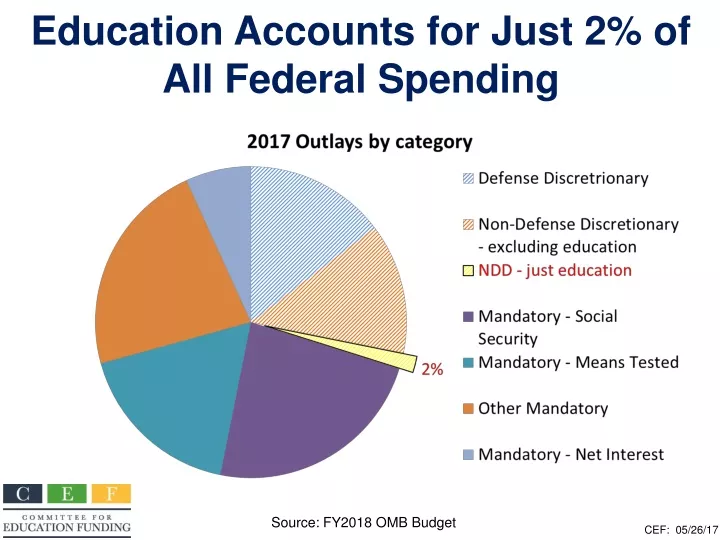
The federal education budget has seen significant cuts, with just 2% of total federal spending allocated to education. Public education spending has remained stagnant since 2010, despite rising K-12 enrollment and student poverty rates. Pell Grants no longer cover the average cost of college, leading to increased student borrowing. There is a clear need for increased federal investment in education.

E N D
Education Accounts for Just 2% of All Federal Spending Source: FY2018 OMB Budget CEF: 05/26/17
Non-Defense Discretionary Levels (in billions) Budget Control Act Caps Sequester Caps CEF: 9/26/16
President’s 2018 Education Budget Far Below 2010 Level Excluding Pell Grants(Department of Education discretionary funds in billions) CEF: 5/24/17
President Trump’s FY 2018 Budget Makes Largest Education Cut Requested change in Dept. of Education discretionary funding vs. prior year, in billions Reagan Does not include FY 2010 request versus FY 2009, which included $97 billion in Recovery Act funds, or FY 2011 request that requested all Pell grant resources as mandatory spending. Source: Department of Education FY 2018 request and budget history tables CEF: 06/08/17
Education Department Discretionary Funding Historyin billions Source: CEF calculations based on Department of Education budget tables: 2017 and 2018 reflect rescission of prior Pell Grant funding
President’s FY 2018 Department of Education Discretionary Funding Source: CEF based on Education Department data
President’sBudget Cuts Department of Education to 1.6% of Federal Budget Department of Education Outlays as a Percent of Total Outlays Source: CEF based on FY 2018 Budget Historical Tables, Table 4.1: https://www.whitehouse.gov/omb/budget/Historicals
60% of Public Wants to Increase Federal Education Investment
Per Student Public Education Spending Virtually Flat Since 2010
Most Students are in High- or Mid-High Poverty Schools Source: NCES Condition of Education, Figure 2, March 2017, https://nces.ed.gov/programs/coe/indicator_clb.asp
U.S. Public K-12 Enrollment Continuing to Rise, Private School Enrollment Declining(Students in thousands) Source: NCES Digest of Education Statistics 2015, tables 203.10 and 205.10, https://nces.ed.gov/programs/digest/current_tables.asp
Number of Recipients by Federal Aid Program (with Average Aid Received), 2015-16 SOURCE: The College Board, Trends in Student Aid 2016, Figure 6A
Total Undergraduate Student Aid by Source and Type (in Billions), 2015-16 SOURCE: The College Board, Trends in Student Aid 2016, Figure 2A
Total Grant Aid in 2015 Dollars by Source of Grant, 1995-96 to 2015-16 SOURCE: The College Board, Trends in Student Aid 2016, Figure 4
Undergraduate Enrollment and Percentage of Undergraduate Students Receiving Pell Grants, 2005-06 to 2015-16 SOURCE: The College Board, Trends in Student Aid 2016, Figure 16
Most Pell Grant Recipients attend Public Colleges Source: FY 2018 Department of Education Congressional Budget Justifications, https://www2.ed.gov/about/overview/budget/budget18/justifications/o-sfa.pdf
Maximum Pell Grant No Longer Covers Much of Average Cost of College SOURCE: College Board
Total Amount Borrowed from Federal Subsidized, Unsubsidized, and PLUS Loans in Millions of 2015 Dollars, 2000-01 to 2015-16, Selected Years SOURCE: The College Board, Trends in Student Aid 2016, Figure 7A
Progress: results for students MORE HISPANIC AND AFRICAN-AMERICAN STUDENTS GRADUATING High school dropout rates: school years 2002 through 2014 SOURCE: U.S. Department of Education, National Center for Education Statistics, Digest of Education Statistics,2015 Table 219.70
Education Pays –Unemployment Rates of Individuals Age 25 and Older, by Education Level, 1995 to 2015 SOURCE: The College Board, Education Pays 2016, Figure 2.12A
State Funding for K-12 Education Has Continued to Erode in Recent Years, Still Below 2008 Level in Real Terms
State Funding for Preschool Below 2002 Level Source: State of Preschool 2016: State Preschool Yearbook, The National Institute for Early Education Research, http://nieer.org/wp-content/uploads/2017/05/YB2016_StateofPreschool2.pdf
Annual Percentage Change in Inflation-Adjusted Per-Student State Funding for Higher Education and in Tuition and Fees at Public Institutions, 1984-85 to 2014-15 SOURCE: The College Board, Trends in College Pricing 2016, Figure 14A
Maximum and Average Pell Grant in 2015 Dollars, 1975-76 to 2015-16 SOURCE: The College Board, Trends in Student Aid 2016, Figure 17