Download
1 / 22
460 likes | 1.3k Views
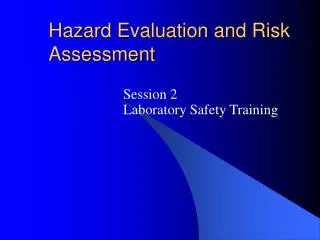
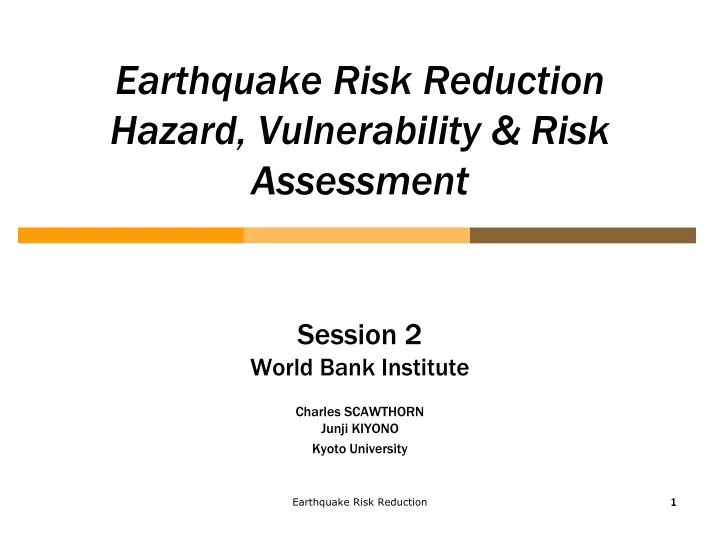
Earthquake Risk Reduction Hazard, Vulnerability & Risk Assessment. Session 2 World Bank Institute Charles SCAWTHORN Junji KIYONO Kyoto University. 1. 1. Outline of Risk Assessment. Input. System. Output. Human/Social Environment. Damage. Earthquake. Hazard. Loss. Vulnerability.

E N D
Earthquake Risk Reduction Hazard, Vulnerability & Risk Assessment Session 2World Bank InstituteCharles SCAWTHORN Junji KIYONO Kyoto University Earthquake Risk Reduction 1 1
Outline of Risk Assessment Input System Output Human/Social Environment Damage Earthquake Hazard Loss Vulnerability Assessment Keywords: Seismic Hazard, Attenuation, Hazard, Vulnerability, Loss Estimation Earthquake Risk Reduction 2 2
landslide shaking tsunami liquefaction faulting fire faulting Seismic Hazards Earthquake Risk Reduction
Liquefaction -1 Earthquake Risk Reduction
Liquefaction Susceptibility (Map Source: PHIVOLCS) Earthquake Risk Reduction
Tsunami Earthquake Risk Reduction
Tectonics and Active Faults in the Philippines Earthquake Risk Reduction
Detailed Fault Map Valley Fault System, Pasig Quadrangle 1:10,000 (Source: PHIVOLCS) Earthquake Risk Reduction
Historical Seismicity, 1608-1985, Metro Manila Region (Source: MMEIRS, 2003) Earthquake Risk Reduction
N(m) 1.0 0.1 0.01 0.001 4 5 6 7 8 Mw Gutenberg-Richter relation (b-value model): Magnitude-frequency relation is the N(m), the number of events equal to or greater than magnitude m. a is a regional constant, and bexpresses the rate of seismicity. The simplest M-f relation is the Gutenberg-Ricter relation: Earthquake Risk Reduction
Attenuation Campbell, K.W. and Bozorgnia, Y. 2003. “Updated Near-Source Ground Motion (Attenuation) Relations for the Horizontal and Vertical Components of Peak Ground Acceleration and Acceleration Response Spectra,” Bull. Seismol. Soc. Am. Earthquake Risk Reduction
Pe pa PGA Seismic Hazard Assessment • Map faults • Estimate EQ occurrence rates • Estimate attenuation • Combine data to estimate Hazard Curve • Provide various measures of the Hazard Hazard Curve Earthquake Risk Reduction
Hazard Maps (Source: MMEIRS) Scenario Shaking Map Liquefaction Potential Map Earthquake Risk Reduction
Seismic Vulnerability • Seismic vulnerability is the degree of loss causedby a given level of hazard. • Seismic vulnerability is a function of ground motion or other hazard intensities. • Typically, the most seismically vulnerable buildings are earthen and low-strength unreinforced masonry, such as stone and brick. • Other vulnerable types of buildings are older reinforced concrete buildings, and buildings with large ground floor openings. Earthquake Risk Reduction
Vulnerability of Reinforced Concrete Buildings - 1 Ordinary RC column in non-seismic area –few ‘lateral’ ties surrounding the longitudinal reinforcement Ductile RC column for seismic area – many ‘lateral’ ties surrounding the longitudinal reinforcement Earthquake Risk Reduction
Vulnerability of Reinforced Concrete Buildings - 2 collapse of RC multistory hotel Baguio, 1990 Philippines Lateral ties failed RC column on highway bridge1994 Northridge (US) earthquake Broken RC column in collapsed building, 2005 SouthAsia earthquake – note small diameter lateral ties spaced far apart Earthquake Risk Reduction
Vulnerability function Vulnerability can be represented as (a) a damage rate of buildings in a area, or as (b) a damage degree for a building itself. 100% Partial damage Heavy damage Damage rate Type I 50% Collapse 0% Seismic intensity 1.0 Collapse Damage degree 0.5 Heavy damage Type II Partial damage 0.0 Seismic intensity Earthquake Risk Reduction
Example Vulnerability Functions Earthquake Risk Reduction
Earthquake Risk - 1 p 1.0 Contribution of each level of severity to total annual cost Annual probability of experiencing severity larger than a Damage (cost ratio) when experience severity, a 0.5 0.0 a* a* Ground motion severity, a Ground motion severity, a Ground motion severity, a • Risk, probabilistic distribution of loss, can be estimated by combining vulnerability functions with the hazard data as shown in the following schematic figure. • Total annual expected cost experiencing severity of ground motion larger than a*is derived from a product of hazard and vulnerability. Hatched area is risk. Hazard Vulnerability Risk Earthquake Risk Reduction
Earthquake Risk - 2 • Earthquake risk is the uncertainty of loss over a specific future time. • Generally, risk is determined as: [R]i = [H]j x [V|H]ij • In which • [R]i is the risk, probability or average rate of loss of elementi due to earthquake intensity j, • [H]j the hazard, probability or average expected rate of experiencing earthquake intensity j, and • [V|H]ij the vulnerability, the level of loss that would be causedto element i given Hazard j (ie, as a result of experiencing earthquake shaking of severity j) Earthquake Risk Reduction
Risk Assessment Example A site’s seismicity is equivalent to MMI every 10 years, MMI 7 every 50 years, etc. On the site, a building will experience 0.1% loss given MMI 6, etc, see Table and graph. Due to the range of seismicity, the average loss per year is 0.28%, as shown in the Table Earthquake Risk Reduction
Loss Estimation Software • There are several software programs that can be used to estimate seismic risk. These include: • REDAS (Rapid Earthquake Damage Assessment System), PHIVOLCS) • HAZUS, available from www.nibs.org • RADIUS, available from www.unisdr.org or Earthquake Risk Reduction