Download
1 / 32
320 likes | 438 Views
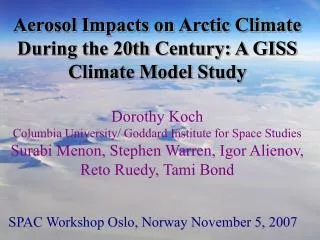
Aerosol effects on 20 th century climate in the GISS Model. Columbia University NASA Goddard Institute for Space Studies. Dorothy Koch Coauthors: Surabi Menon , Drew Shindell , Susanne Bauer, Greg Faluvegi , Gavin Schmidt , Anthony Del Genio , David Rind,

E N D
Aerosol effects on 20th century climate in the GISS Model Columbia University NASA Goddard Institute for Space Studies Dorothy Koch Coauthors: SurabiMenon, Drew Shindell, Susanne Bauer, Greg Faluvegi, Gavin Schmidt, Anthony Del Genio, David Rind, Ron Miller,RetoRuedy, Joe McConnell GSFC AEROCENTER Update April 29, 2010
Global mean, 200-year perspective However short-lived pollutants vary strongly in time and region Sulfate BC IPCC AR4 Ch2
Greenland ice core records McConnell et al., 2007Indicator of North American pollution changes Oil, Gas Coal
Our “On-line”: Aerosol-Climate Simulations Previous study: Koch et al., J. Clim., 2009: Aerosol-climate coupling inequilibriumsimulations for 1890, 2000 with Q-flux slab ocean. • Current: Koch et al.,(J. Clim., in revision) • Aerosols-ozone-chemistry • Coupled to climate including dynamic ocean • Transient simulation from 1890 to 2000 • Other forcings included (e.g. GHG, solar, volcanic aerosols, etc) • Three sets of ensembles allow isolation of aerosol effects: • Direct • Indirect • BC-snow-albedo
(Interactive) Aerosol Effects 3. BC-albedo effect: BC deposited on snow reduces snow albedo and promotes melting Warren and Clarke, 1986 1. Direct effect:scattering, absorption ofradiation. Menonand Rotstayn, 2006 2. Indirect cloud effect 3. BC snow-albedo effect
Emissions Trends Normalized to 1890 • Emissions: • SO2, NOx, CO etc: EDGAR (van Aardenne et al., 2001; EDGAR32_FT) • BC, OC: Bond et al. (2007) • Biomass burning:GFED (scaled to 1/2 in tropics for 1880, increasing linearly to 2000) • Natural sources
Model vs observations, North America BC, sulfate trends compared to Greenland ice core data core STD IE ACT2 McConnell et al., 2007 BC air concentration history derived from NY lakecore BC Core model Husain et al., 2008
Model sulfur is nearly perfect in the US, in magnitude and trend Model (dashed) • NADP data (solid)
Europe and China Black Carbon ice core (Lavanchy et al., 1999) model Sulfur ice core (Preunkert et al., 2001) Black Carbon, Lake core concentrations, Yongming Han, personal comm. (data scaled arbitrarily) obs model Yangtzee Delta Inner Mongolia NE Tibetan Plateau South coast
TOA forcing changes Global [Arctic] Sulfate
TOA forcing changes Global [Arctic] Sulfate Black Carbon in the Atmosphere Black Carbon on snow
Dimming/brightening changesObserved Wild et al., 2005, Science 308 Surface radiation changes Century 1890s to 1940s 1940s to 1980s 1980s to 1990s Dimming brightening
Surface Air Temperature warming stable warming Aerosol effects contribute to temperature, snow/ice changes during these periods
Observed Surface Air Temperature changes GISS observed temperature analysis century warmer neutral warmer
Observed Surface Air Temperature changes Global [Arctic] Modeled SAT changes IE: better Model OK until theend, then too cool.
Aerosol effects on Surface Air Temperature (SAT) changes All effects Indirect effect cools Local warming (Not enough?) BC-albedo effect warms Cools Global [Arctic]
Model snow/ice cover changes All effects Arctic melting! More snow Indirect effect More snow/ice!! Arctic melting BC-albedo effect Global [Arctic]
“Mitigation” Sensitivity studies 1970-2000 Starting in 1970, branch 3 experiments, run to 2000 (no indirect effect) Cooling experiments: • Pollution BC = 0(-0.3 W/m2) 2. Long-lived GHG at 1970 levels (-1 W/m2) Warming Experiment: 3. Pollution sulfur = 0 (+0.4 W/m2)
Global Surface Air Temperature Trend Sulfur GHG=1970 Standard BC Observed Sulfur reduction, “unmasking”: much warmer BC, GHG reductions, only small cooling Due to thermal inertia, warming in “pipeline”
D(Mitigation – STD) BC GHG=1970 Sulfur
D(Mitigation – STD) BC Less clouds (warming) GHG=1970 More clouds (cooling) Sulfur Less clouds (warming)
Koch and Del Genio, ACPD, review paper:“Black carbon absorption effects on cloud cover”
Conclusions BC, BC-snow-albedoare important warming agents early in century. Over century BC-snow-albedoeffect caused 20% of Arctic snow/ice loss. Sulfate and the indirect effect caused strong dimming and cooling from 1940s to 1980s. Some decline in sulfur from Europe contributes to warming (“unmasking”) in final decades. Why does model fail to warm enough from 1970 to 2000? Maybe sulfur emissions do not decline enough? Smith et al. (2004) has ‘better’ trend-shape (AR5 emissions).
4.Transient climate is a new challenge for the indirect effect!The IE cloudresponseis stronger in the transient deep-ocean simulations than Qflux equilibrium simulations. We will repeat these experiments using our new aerosol (MATRIX, Bauer et al., 2008) and cloud (Menon et al.) microphysical schemes. 5. “Mitigation”: Reduction of sulfur causes strong warming; reduction of BC does not cool very much. Arctic benefits more from reduced GHG than BCdue to the cloud response (in our model). 6. The “semi-direct” effects of BC on clouds: net cloud-cover increases due to BC in many global models, requires further study (Koch and Del Genio, ACPD, 2010). Conclusions
Thanks! Funded by: NASA MAP, Clean Air Task Force
Model without indirect effect (STD) warms the right amount. Modeled SAT Observed SAT But too warm mid-century. Use IE from our Q-flux model experiments…
Surface Air Temperature trend Model with indirect effect (IE1)
First IE try: Surface Air Temperature trend Indirect effect (IE1) experiment Failed! The cloudresponseis stronger in the transientdeep-ocean compared toequilibrium slab-ocean run…
Cloud forcing change (1990-1890) for Q-flux, IE1 Qflux ocean IE1 deep ocean Qflux equilibrium: shallow ocean warms faster, fewer low clouds IE1 transient deep ocean: ocean not as warm, more low clouds, more negative cloud forcing (colder)
IE2: weaker indirect effect IE2: weaker sulfate dependence. This model does not include aerosol microphysics (mixing). Mixing might reduce number of CCN. (Menon and Rotstayn, 2006) Our model Real world
Model snow/ice cover changes All effects Indirect effect Arctic melting! More snow BC-albedo effect Arctic melting More snow/ice!! Global [Arctic]
Unmasking! BC GHG=1970 Sulfur