Download
1 / 15
150 likes | 258 Views
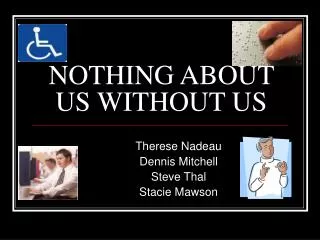
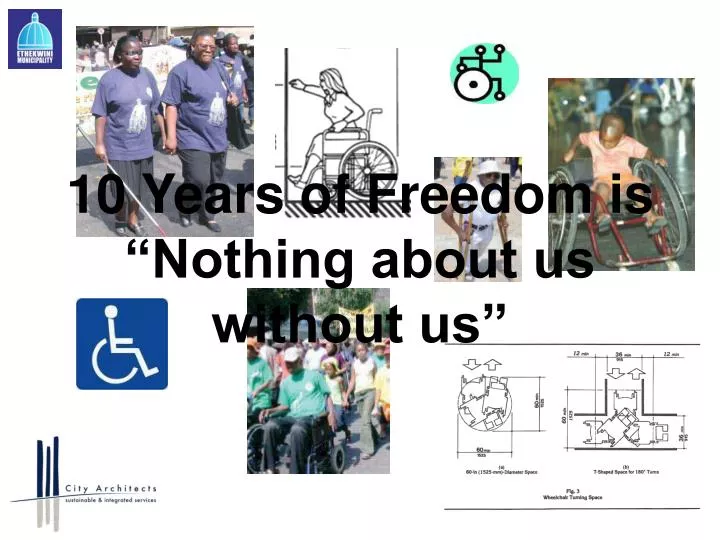
10 Years of Freedom is “Nothing about us without us”. CSA1773 ACCESSIBILITY FOR PERSONS WITH DISABILITIES. BACKGROUND

E N D
BACKGROUND Since the late 1980’s, the Architecture Department has been pursuing a programme of accessibility to Council buildings. This was characterised by an Universal Design approach to new projects as well as the retrofitting of existing facilities
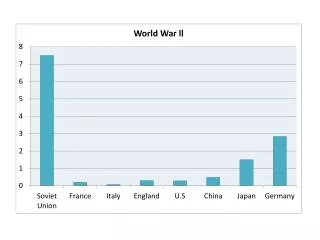
Table 1(a): Statistical Information on Disability. Source: Stats SA Census Report 2001 Totals (Male) Sight 245 681 Physical 281 099 Hearing 147 603 Intellectual 107 521 Communication 40 067 Emotional 142 951 Multiple 117 119 Subtotal All 1 082 041
The largest percentage of male disabled persons is physically disabled, followed by visually impaired persons. Statistics also reflect the fact that a substantial number of male disabled persons have more than one disability.
Table 1 (b): Distribution of female persons with disability (Stats SA 2001) FemaleSight 331 412 Physical 276 415 Hearing 165 980 Intellectual 98 928 Communication 35 385 Emotional 125 762Multiple 140 050Subtotal All 1 173 932
Budgetary and delivery constraints resulted in an unplanned ‘slow-down’ of the retrofitting initiative which created a backlog
In August 2009, and in an endeavour to improve the City’s accessibility ahead of the 2010 Soccer World Cup, the programme was accelerated with a strategic upgrade project involving an estimated 500 existing buildings and properties.
A total of 547 buildings were surveyed and a report was compiled detailing compliance with relevant legislation (SABS 0400 – 1990 NBR Byelaws and SABS 0246 – Accessibility to buildings for disabled persons), required interventions and priority.