Download
1 / 30
300 likes | 423 Views
Using the Maryland Biological Stream Survey Data to Test Spatial Statistical Models. N. Scott Urquhart. Joint work with Erin E. Peterson, Andrew A. Merton, David M. Theobald, and Jennifer A. Hoeting All of Colorado State University, Fort Collins, CO 80523-1877. This research is funded by

E N D
Using the Maryland Biological Stream Survey Data to Test Spatial Statistical Models N. Scott Urquhart Joint work with Erin E. Peterson, Andrew A. Merton, David M. Theobald, and Jennifer A. Hoeting All of Colorado State University, Fort Collins, CO 80523-1877
This research is funded by U.S.EPA – Science To Achieve Results (STAR) Program Cooperative Agreement # CR - 829095 FUNDING ACKNOWLEDGEMENT The work reported here today was developed under the STAR Research Assistance Agreement CR-829095 awarded by the U.S. Environmental Protection Agency (EPA) to Colorado State University. This presentation has not been formally reviewed by EPA. The views expressed here are solely those of presenter and STARMAP, the Program he represents. EPA does not endorse any products or commercial services mentioned in this presentation.
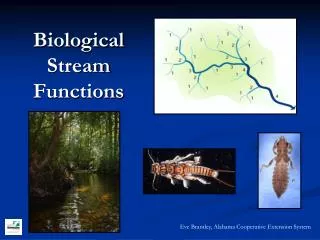
Electrofishing during EMAP sampling (Theobald, 2003) The Problem • Too many streams • Limited personnel • Cost of sampling is high • Rapid assessment is difficult • Lawsuits filed by environmental groups demanding that the requirements of the CWA be met
Probability-Based Random Survey Designs • Used to meet the requirements of CWA Section 305(b) • Derive a regional estimate of stream condition • Categorize and assign a weight based on stream order • Provides a representative sample of streams • 1st, 2nd, and 3rd order • Generate a statistical inference about the population of streams, within stream order, over a large area • Disadvantage • Does not identify the spatial location of impaired stream segments
PURPOSE • Develop a geostatistical methodology based on • Coarse-scale GIS data & • Field surveys • To predict • Water quality characteristics of Stream segments found throughout a large geographic area (e.g., state)
N Maryland Biological Stream Survey (MBSS) Sample Site Locations
OUR PATH TODAY • What are “Spatial Statistical Models”? • Measuring Distance in Space • The Maryland Biological Stream Survey • Outstanding data set to compare models • Sketch Models Characteristics • A Few Results • This Talk Reports Work in Progress
GATHERING SOME INSIGHTS • Raise your hand if you • Had a statistics course – even in the distant past • Remember doing a t-test • Did a simple linear regression (fitted a line) • Did a multiple regression • Examined model failures • Did analyses accommodating “correlated errors” • Have used spatial statistics, eg, kriging
STATISTICS AND PREDICTION • OBJECTIVE: Measure relevant responses, • Like dissolved organic carbon (DOC), and • Related variables at suitable sites, then • Develop formula to predict DOC at • Unvisited sites • Why? • Clean Water Act (CWA) 303(d) • Requires states to identify “impacted” waters and plan to eliminate impact. • What state has the $ to evaluate every water? Do survey, model=>predict, instead.
PREDICTIVE VARIABLES • Predict DOC from measures such as • Area above the stream evaluation point • % Barren • % High Intensity Urban • % Woody Wetland (* = included for DOC) • % Conifer or Evergreen Forest Type (*) • % Mixed Forest Type (*) • % low intensity Urban (*) • To accommodate year diff’s: • 1996 & 1997 (*)
GIS TOOLS • These variables require • Efficient delineation of watershed above any point. • STARMAP has developed such software. • It is available. • Documented in a poster here, and on this web site: • www.nrel.colostate.edu/projects/starmap/
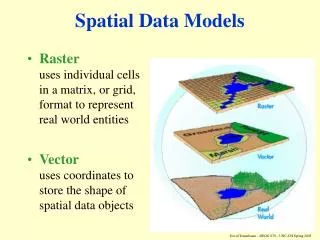
PREDICTIVE MODELS • Classical regression model would be: • BUT “Everything is related to everything else, but near things are more related than distant things” Tobler (1970). • Thus the “uncorrelated” above is indefensible in many cases
SO WHAT ISSPATIAL STATISTICS? • Spatial Statistics is a set of statistical analysis techniques which • Allow correlated data, • Index the amount of correlation by distance the points are apart, • Incorporate this correlation into predictions.
MEASURING DISTANCE IN SPACE • Choices: • In a straight line - “as the bird flies” • Or network based – “As the fish swims” • Traditional spatial statistics uses the first measure. • Our research has investigated the second: • Models • Tested and compared using MBSS data
2 1 3 1 2 3 1 2 Symmetric Hydrologic Straight-line Asymmetric Hydrologic 3 GIS TOOLS USED = FLoWS Automated tools needed to extract data about hydrologic relationships between sample points did not exist! • Calculate watershed covariates for each stream segment • Calculate separation distances between sites 3. Convert GIS data to a format compatible with statistics software
The Maryland Biological Stream Survey(MBSS) • Outstanding data set to compare models • Maryland Department of Natural Resources • 1995, 1996, 1997 • Stratified probability-based random survey design • 955 sites in 17 interbasins • Snapped sites to streams • 74 sites were discarded • Could not locate survey segment
DATA USED • Some of our studies have used the entire set of 881 (955-74) sites • Today’s report focuses on data • Collected in 1996 • To reduce differences in DOC resulting from interannual variation, and • Reduce computational load • Seven interbasins were visited • 343 DOC samples were collected (312 usable) • Between March 1 and May 1, 1996.
N DISSOLVED ORGANIC CARBON DATA USED IN THIS ILLUSTRATION
Autocovariance Distance Model Measure MSPE r2 Exponential SLD 0.9394 0.7190 WAHD 1.2337 0.6368 Spherical SLD 1.3391 0.6029 WAHD 1.2187 0.6428 Mariah SLD 0.9311 0.7221 WAHD 1.2326 0.6346 Hole Effect SLD 1.0136 0.6983 Linear with Sill WAHD 1.2141 0.6388 Rational Quadratic SLD 0.9447 0.7177 RESULTS • SLD models performed better than WAHD • Exception: Spherical model • Best models: • SLD Exponential, Mariah, and Rational Quadratic models • r2 for SLD model predictions WAHD: weighted asymmetric hydrologic distance SLD: straight-line distance • Model predictions are almost identical • Further analysis was restricted to Mariah
Results: Observed vs. predicted values • 312 sites • r2 = 0.72 • One influential site • r2 without that site = 0.66
WHERE DID WE PREDICT DOC? • The seven interbasins surveyed in 1996 • Contained 3083 first, second, and third order non-tidal stream segments. • We created 3083 prediction locations by locating the downstream node of each stream segment. • We used the downstream node to ensure that the entire segment was located within the same watershed. • This caused more than one prediction location to be positioned at stream confluences. • The covariates for the prediction locations represented the watershed conditions of the individual segment rather than the confluence, • Which would include all of the segments that flow into that location.
Geostatistical Models with Strong Predictive Ability • Dominated by coarse-scale landscape variables that are not constrained to watershed boundaries • ANC, PHLAB, NO3, and COND • Affected by landscape variables • Geology type, agricultural & urban areas, atmospheric deposition of nitric and sulfuric acids • Small nuggets < 7.5% of variability • Sample scale captured most variability in the data • DOC • Affected by allochthonous sources of organic matter • Terrestrial plant material, soil, groundwater inputs, wetlands • Flow path is important: overland, sub-surface, groundwater • Large nugget • Failure to represent the terrestrial flow path • Point sources of organic pollution • Fine-scale instream processes
Geostatistical Models with Weak Predictive Ability • **Impossible to determine the source of the residual error** • SO4 • Influenced by coarse scale processes • Atmospheric inputs of sulfur, weathering of sulfate minerals • Results were inconclusive • Similar to other studies (Herlihy et al., 1998) • What does this mean? • Finer scale processes dominate spatial patterns SO4? • Well documented affects of atmospheric deposition of sulfuric acid • We proposed a poor model • Impossible to detect strong patterns of spatial autocorrelation at any scale TEMP & DO • Spatially and temporally variable over short distances • Biological oxygen demand or water depth • Dominant ecological processes occur at a scale finer than the minimum separation distance in the MBSS (50 m)
CONCLUSIONS • Spatial autocorrelation exists in stream chemistry data at a relatively coarse scale • Geostatistical models improve the accuracy of predictions • Patterns of spatial autocorrelation differ between chemical response variables • Influenced by ecological processes acting at different spatial and temporal scales
CONCLUSIONS - II • Our results are scale specific • Spatial patterns change with sample scale. • Other patterns may emerge with shorter minimum separation distances. • Straight line measures of distance are OK. • Further research is needed at finer scales • Watershed or reach scale • Questions are welcome – now or later