Download
1 / 24
240 likes | 340 Views
“BOF” Trees Diagram as a Visual Way to Improve Interpretability of Tree Ensembles. Vesna Luzar-Stiffler, Ph.D. University Computing Centre, and CAIR Research Centre, Zagreb, Croatia Charles Stiffler, Ph.D. CAIR Research Centre, Zagreb, Croatia

E N D
“BOF” Trees Diagram as a Visual Way to Improve Interpretability of Tree Ensembles Vesna Luzar-Stiffler, Ph.D. University Computing Centre, and CAIR Research Centre, Zagreb, Croatia Charles Stiffler, Ph.D. CAIR Research Centre, Zagreb, Croatia vluzar@srce.hr, charles.stiffler@cair-center.hr
Outline • Introduction/Background • Trees • Ensemble Trees • Visualization Tools • Simulation Results • Web Survey Results • Conclusions/Recommendations
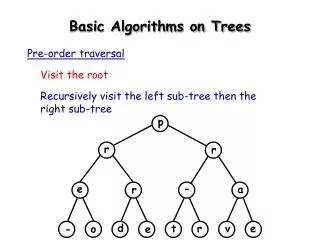
Introduction / Background • Classification / Decision Trees • Data mining (statistical learning) method for classification • Invented twice: • Statistical community: Breiman: Friedman et.al. (1984) • Machine Learning community: Quinlan (1986) • Many positive features • Interpretability, ability to handle data of mixed type and missing values, robustness to outliers, etc. • Disadvantage • unstable vis-à-vis seemingly minor data perturbations low predictive power
Introduction / Background • Possible improvements: Ensembles • Bagging i.e., Bootstraping trees (Breiman, 1996) • Boosting, e.g., AdaBoost (Freund & Schapire, 1997) • Random Forests (Breiman, 2001) • Stacking, randomized trees, etc. • Advantage: • Improved prediction • Disadvantage • Loss of interpretability (“black box”)
Let be the classification tree prediction at input x obtained from the full “training” data Z= {(x1,y1),(x2,y2)…(xN,yN)} Classification Tree
Let be the classification tree prediction at input x obtained from the bootstrap sample Z*b, b=1,2,…B. Bagging estimate: Bagging Classification Tree 1 2 B
Visualization tools • Graphs based on predictor “importances” (Bxp) matrix F (p=# of predictors) For bagged trees, we take the avg: • Diagram 1, importance mean bar chart • Diagram 2, (“BOF Clusters”) is the cluster means chart (NEW) • Diagram 3, (“BOF MDPREF”) is the multidimensional preference bi-plot (NEW)
Visualization tools • Graphs based on proximity (nxn) matrix P, (n=# of cases) • Diagram 4 (“Proximity Clusters”) is the cluster means chart (Breiman,2002) • Diagram 5 (“Proximity MDS”) is the multidimensional scaling plot of “similar” cases (Breiman,2002)
S1: Generate a sample of size n=30, two classes, and p=5 variables (x1-x5), with a standard normal distribution and pair-wise correlation 0.95. The responses are generated according to Pr(Y=1|x1≤0.5) = 0.2, Pr(Y=1|x1>0.5)=0.8. S2: Generate a sample of size n=30, two classes, and p=5 variables (x1-x5), with a standard normal distribution and pair-wise correlation 0.95 between x1 and x2, and 0 among other predictors. The responses are generated according to Pr(Y=1|x1≤0.5) = 0.2, Pr(Y=1|x1>0.5)=0.8. Simulation experiments
Diagram 3, “BOF MDPREF” S1 S2
Web Survey data • ICT infrastructure/usage in Croatian primary and secondary schools • 25,000+ teachers (cases) • 200+ variables • Response: “classroom use of a computer by educators” (yes/no) • Partition • 50% training • 25% validation • 25% test
Conclusions/ Recommendations • There are SWs for trees • There are some SWs for tree ensembles • There are some visualization tools (old and new) • The problem is • they are not “interfaced” (integrated)