Download
1 / 63
630 likes | 647 Views
Delve into the intense background radiation of the universe, its impact on cluster structures, and the profound cosmological implications observed through the Sunyaev-Zel’dovich effect. Learn about the origin, observations, and implications of this significant phenomenon.

E N D
The microwave background radiation and the Sunyaev-Zel’dovich effect Mark Birkinshaw
Outline • The microwave background • The origin of the SZ effect • SZ observations today • Cluster structures and SZ effects • Cosmology and SZ effects • AMiBA and OCRA • Summary Mark Birkinshaw, U. Bristol
1. The microwave background • Provides an intense background thermal radiation • illuminates foreground structures • Has significant structure itself • limits “shadowology” • Has polarization structure • limits foreground polarization studies Mark Birkinshaw, U. Bristol
COBE/FIRAS spectrum FIRAS results: T = 2.728 ± 0.002 K, |y| < 15 10-6, || < 9 10-5 (Fixsen et al. 1996) Mark Birkinshaw, U. Bristol
COBE/FIRAS+DMR dipole FIRAS and DMR measured the dipole: amplitude = 3.372 ± 0.007 mK direction (l,b) = (264.14° ± 0.15°, 48.26° ± 0.15°) (FIRAS values, consistent with DMR, but more precise) Can ignore deviation from monopole temperature. Mark Birkinshaw, U. Bristol
BOOMERanG power spectrum Predicted power spectra (MAP errors) Hu & White (1997) Temperature power spectrum BOOMERanG Netterfield et al. (2002) Mark Birkinshaw, U. Bristol
Power spectrum interpretation • Peak locations show Universe is flat • k = –0.02 ± 0.06 • Fluctuations close to Harrison-Zel’dovich • ns = 0.96 ± 0.10 • Peak heights give matter contents • b = (0.022 ± 0.004) h2 • CDM = (0.13 ± 0.05) h2 • Cosmological concordance still good Netterfield et al. (2002) Mark Birkinshaw, U. Bristol
Polarization E-mode polarization detection DASI Mark Birkinshaw, U. Bristol
2. The origin of the SZ effect Clusters of galaxies contain extensive hot atmospheres Te 6 keV np 103 protons m-3 L 1 Mpc 2 Mpc Mark Birkinshaw, U. Bristol
Inverse-Compton scatterings • Cluster atmospheres scatter photons passing through them. Central iC optical depth tenp sT L 10-2 • Each scattering changes the photon frequency by a fraction Mark Birkinshaw, U. Bristol
Single-scattering frequency shift P1(s) s = log() 5 keV 15 keV Mark Birkinshaw, U. Bristol
Thermal SZ effect • The fractional intensity change in the background radiation I/I = -2 (n/n)te 10-4 • Effect in brightness temperature terms is DTRJ = -2 Tr(n/n)te -300 K • Brightness temperature effect, DTRJ, is independent of redshift Mark Birkinshaw, U. Bristol
Microwave background spectrum I Mark Birkinshaw, U. Bristol
Spectrum of thermal effect • effect caused by small frequency shifts, so spectrum related to gradient of CMB spectrum • zero at peak of CMB spectrum Mark Birkinshaw, U. Bristol
Temperature sensitivity • Te < 5 keV: e– non-relativistic, effect independent of Te • Te > 5 keV: enough e– relativistic that spectrum is function of Te • Te > 1 GeV: spectrum independent of Te, negative of CMB (non-thermal SZ effect) 5 keV 15 keV Mark Birkinshaw, U. Bristol
Spectrum of kinematic effect • effect caused by reference frame change, related to CMB spectrum • maximum at peak of CMB spectrum • negative of CMB spectrum Mark Birkinshaw, U. Bristol
Attributes of SZ effect • TRJ is a redshift-independent function of cluster properties only. If the gas temperature is known, it is aleptometer • TRJ contains a weak redshift-independent kinematic effect, it is aradial speedometer • TRJ has a strong association with rich clusters of galaxies, it is amass finder • TRJ has polarization with potentially more uses, but signal is tiny Mark Birkinshaw, U. Bristol
3. SZ observations today • Interferometers: Ryle, BIMA, OVRO, … • Structural information • Baseline range • Single-dish radiometers: 40-m, Corona, … • Speed • Systematic effects • Bolometers: SuZIE, MAD, ACBAR, … • Frequency coverage • Weather Mark Birkinshaw, U. Bristol
Interferometers • restricted angular dynamic range set by baseline and antenna size • good rejection of confusing radio sources Abell 665 model, VLA observation Mark Birkinshaw, U. Bristol
Interferometers • good sky and ground noise rejection because of phase data • long integrations and high signal/noise possible • 10 years of data, tens of cluster maps • SZ detected for cluster redshifts from 0.02 (VSA) to 1.0 (BIMA) Mark Birkinshaw, U. Bristol
Ryle telescope • first interferometric map • Abell 2218 • brightness agrees with single-dish data • limited angular dynamic range Figure from Jones et al. 1993 Mark Birkinshaw, U. Bristol
BIMA/OVRO • limited angular dynamic range • high signal/noise (with enough tint) • clusters easily detectable to z 1 Figure from Carlstrom et al. 1999 Mark Birkinshaw, U. Bristol
Single-dish radiometers • Potentially fast way to measure SZ effects of particular clusters • Multi-beams better than single beams at subtracting atmosphere, limit cluster choice • Less fashionable now than formerly: other techniques have improved faster • New opportunities: e.g., GBT Mark Birkinshaw, U. Bristol
OVRO 40-m • Crude mapping possible • Difficulties with variable sources • Relatively fast for detections of SZ effects Figure from Birkinshaw 1999 Mark Birkinshaw, U. Bristol
Viper telescope at the South Pole • 1998-2000: 1-pixel receiver (Corona); 40 GHz • Since 2001: 16-pixel bolometer (ACBAR); 150, 220, 275 GHz • Dry air, 3º chopping tertiary, large ground shield • Excellent for SZ work Mark Birkinshaw, U. Bristol
1999 Corona observation of A3667 • A 3667: brightest z < 0.1 REFLEX cluster far enough South for Viper • 3.6 º 2.0º raster scan shows cold spot at the X-ray centroid and hot regions at the radio halo • H0=64 km s-1 Mpc-1 Cantalupo, Romer, et al. Mark Birkinshaw, U. Bristol
Bolometers • Should be fast way to survey for SZ effects • Wide frequency range possible on single telescope, allowing subtraction of primary CMB structures • Atmosphere a problem at every ground site • Several experiments continuing, SuZIE, MITO, ACBAR, BOLOCAM, etc. Mark Birkinshaw, U. Bristol
SCUBA 850 µm images: SZ effect measured in one; field too small Mark Birkinshaw, U. Bristol
MITO • MITO experiment at Testagrigia • 4-channel photometer: separate components • 17 arcmin FWHM • Coma cluster detection Figure from De Petris et al. 2002 Mark Birkinshaw, U. Bristol
ACBAR cluster observations • ACBAR produces simultaneous 3-frequency images, subtracts primary CMB fluctuations • Observing complete luminosity-limited sample (~10 REFLEX clusters) with Viper • XMM/Chandra and weak lensing data • AS1063, 0658-556, A3667, A3266, A3827, A3112, A3158 already imaged Romer, Gomez, Peterson, Holzapfel, Ruhl et al. Mark Birkinshaw, U. Bristol
4. Cluster structures and SZ effects • Integrated SZ effects • total thermal energy content • total hot electron content • SZ structures • not as sensitive as X-ray data • need for gas temperature • Radial velocity of clusters via kinematic effect • Mass structures and relationship to lensing Mark Birkinshaw, U. Bristol
Integrated SZ effects • Total SZ flux density Thermal energy content immediately measured in redshift-independent way Virial theorem then suggests SZ flux density is direct measure of gravitational potential energy Mark Birkinshaw, U. Bristol
Integrated SZ effects • Total SZ flux density If have X-ray temperature, then SZ flux density measures electron count, Ne (and hence baryon count) Combine with X-ray derived mass to get fb Mark Birkinshaw, U. Bristol
Radial velocity • Kinematic effect separable from thermal SZ effect because of different spectrum • Confusion with primary CMB fluctuations limits velocity accuracy to about 150 km s-1 • If velocity substructure in atmospheres, even less accuracy will be possible • Statistical measure of velocity distribution of clusters as a function of redshift in samples Mark Birkinshaw, U. Bristol
Cluster velocities Need • good SZ spectrum • X-ray temperature Confused by CMB structure Sample vz2 Three clusters so far, vz 1000 km s A 2163; figure from LaRoque et al. 2002. Mark Birkinshaw, U. Bristol
SZ effect structures • Currently only crudely measured by any method (restricted angular dynamic range) • X-ray based structures superior • Structure should be more extended in SZ than in X-ray because of nerather than ne2dependence, so good SZ structure should extend out further and show more about halo Mark Birkinshaw, U. Bristol
Cluster distances and masses DA = 1.36 0.15 Gpc H0 = 68 8 18 km s-1 Mpc-1 Mtot(250 kpc) = (2.0 0.1) 1014 M XMM+SZ Mtot(250 kpc) = (2.7 0.9) 1014 M lensing Mgas(250 kpc) = (2.6 0.2) 1013 M XMM+SZ CL 0016+16 with XMM; Worrall & Birkinshaw 2002 Mark Birkinshaw, U. Bristol
5. Cosmology and SZ effects • Cosmological parameters • cluster-based Hubble diagram • cluster counts as function of redshift • Cluster evolution physics • evolution of cluster atmospheres via cluster counts • evolution of radial velocity distribution • evolution of baryon fraction • Microwave background temperature elsewhere in Universe Mark Birkinshaw, U. Bristol
Cluster Hubble diagram X-ray surface brightness X ne2 Te½ L SZ effect intensity change I ne Te L Eliminate unknown ne • L I2 X1 Te3/2 H0 XI2 Te3/2 Mark Birkinshaw, U. Bristol
Hubble diagram • poor leverage for other parameters • need many clusters at z > 0.5 • need reduced random errors • ad hoc sample • systematic errors Mark Birkinshaw, U. Bristol
Critical assumptions • spherical cluster (or randomly-oriented sample) • knowledge of density and temperature structure to get form factors • clumping negligible • selection effects understood need orientation-independent sample Mark Birkinshaw, U. Bristol
SZ effect surveys • SZ-selected samples needed for reliable cosmology • almost mass limited • flat redshift response • X-ray samples • SZ follow-ups for ROSAT-derived samples • selects more stratified clusters • Optical samples • much used in past, line-of-sight confusion problem Mark Birkinshaw, U. Bristol
Distribution of central SZ effects • Mixed sample of 37 clusters • OVRO 40-m data, 18.5 GHz • No radio source corrections • 40% of clusters have observable T < –100 K Mark Birkinshaw, U. Bristol
Cluster counts and cosmology dN/dz Cluster counts and redshift distribution provide strong constraints on 8, m, and cluster heating. Wm=1.0 WL=0 s8=0.52 Wm=0.3 WL=0.7 s8=0.93 Wm=0.3 WL=0 s8=0.87 z Figure from Fan & Chiueh 2000 Mark Birkinshaw, U. Bristol
Baryon mass fraction SRJ Ne Te Total SZ flux total electron count total baryon content. Compare with total mass (from X-ray or gravitational lensing) baryon fraction b/m Figure from Carlstrom et al. 1999. Mark Birkinshaw, U. Bristol
Cluster velocities Confused by CMB structure, cluster velocity errors of 150 km s-1 at best (currently worse) Sample could give z2(z): dynamics A 2163; figure from LaRoque et al. 2002. Mark Birkinshaw, U. Bristol
Microwave background temperature • Ratio of SZ effects at two different frequencies is a function of CMB temperature (with slight dependence on Te and cluster velocity) • So can use SZ effect spectrum to measure CMB temperature at distant locations and over range of redshifts • Test T (1 + z) Mark Birkinshaw, U. Bristol
Microwave background temperature • Test T (1 + z) • SZ results for two clusters plus results from molecular excitation Battistelli et al. (2002) Mark Birkinshaw, U. Bristol
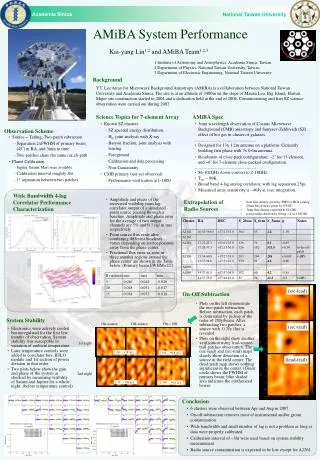
6. AMiBA and OCRA • Many new SZ facilities under development • bolometers and interferometers most popular • south pole, Chile, Mauna Kea, Tenerife • AMiBA • ASIAA/NTU development • operational in 2003 • OCRA • -p operational in 2003, -F in 2005 Mark Birkinshaw, U. Bristol
New SZ facilities • AMiBA • OCRA (-p, -F, -) • AMI • MAP • Planck • SuZIE-n • BOLOCAM • CARMA • ALMA • SZA • ACBAR • MITO/MAD • APEX • etc., etc., etc. Mark Birkinshaw, U. Bristol