Download
1 / 1
10 likes | 110 Views
Academia Sinica. National Taiwan University. AMiBA Spec. 3mm wavelength observation of Cosmic Microwave Background (CMB) anisotropy and Sunyaev-Zeldovich (SZ) effect of hot gas in cluster of galaxies. --------------------------------------

E N D
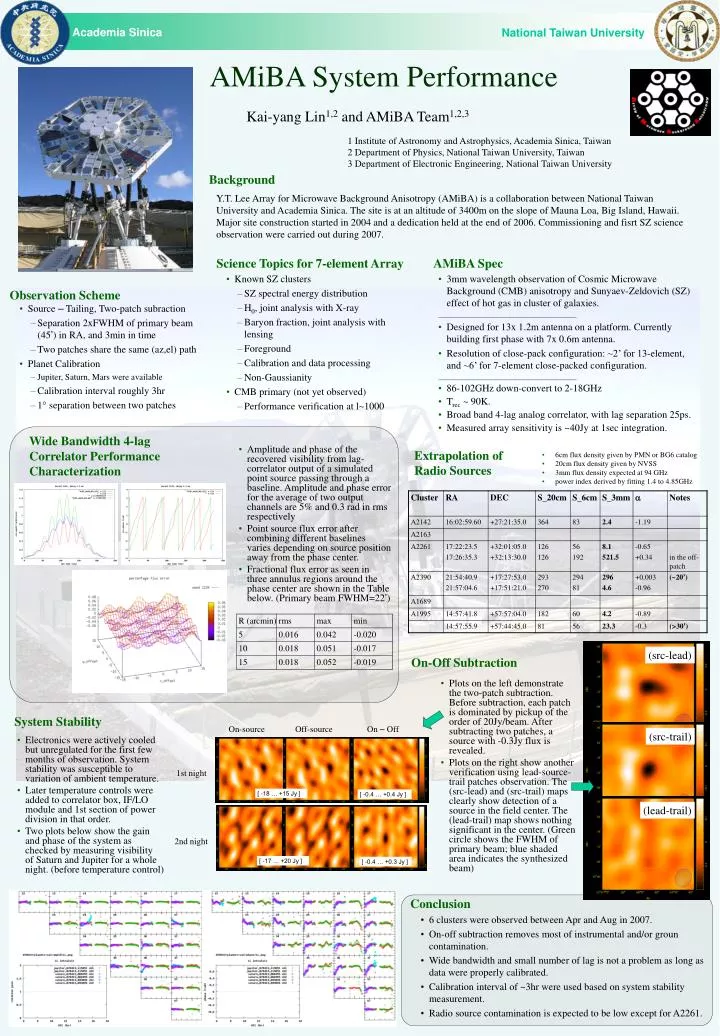
Academia Sinica National Taiwan University AMiBA Spec • 3mm wavelength observation of Cosmic Microwave Background (CMB) anisotropy and Sunyaev-Zeldovich (SZ) effect of hot gas in cluster of galaxies. -------------------------------------- • Designed for 13x 1.2m antenna on a platform. Currently building first phase with 7x 0.6m antenna. • Resolution of close-pack configuration: ~2’ for 13-element, and ~6’ for 7-element close-packed configuration. -------------------------------------- • 86-102GHz down-convert to 2-18GHz • Trec ~ 90K. • Broad band 4-lag analog correlator, with lag separation 25ps. • Measured array sensitivity is ~40Jy at 1sec integration. Background Y.T. Lee Array for Microwave Background Anisotropy (AMiBA) is a collaboration between National Taiwan University and Academia Sinica. The site is at an altitude of 3400m on the slope of Mauna Loa, Big Island, Hawaii. Major site construction started in 2004 and a dedication held at the end of 2006. Commissioning and fisrt SZ science observation were carried out during 2007. On-source Off-source On – Off 1st night [ -18 … +15 Jy ] [ -0.4 … +0.4 Jy ] 2nd night [ -17 … +20 Jy ] [ -0.4 … +0.3 Jy ] AMiBA System Performance Kai-yang Lin1,2 and AMiBA Team1,2,3 1 Institute of Astronomy and Astrophysics, Academia Sinica, Taiwan 2 Department of Physics, National Taiwan University, Taiwan 3 Department of Electronic Engineering, National Taiwan University Science Topics for 7-element Array • Known SZ clusters • SZ spectral energy distribution • H0, joint analysis with X-ray • Baryon fraction, joint analysis with lensing • Foreground • Calibration and data processing • Non-Gaussianity • CMB primary (not yet observed) • Performance verification at l~1000 Observation Scheme • Source – Tailing, Two-patch subraction • Separation 2xFWHM of primary beam (45’) in RA, and 3min in time • Two patches share the same (az,el) path • Planet Calibration • Jupiter, Saturn, Mars were available • Calibration interval roughly 3hr • 1 separation between two patches Wide Bandwidth 4-lag Correlator Performance Characterization • Amplitude and phase of the recovered visibility from lag-correlator output of a simulated point source passing through a baseline. Amplitude and phase error for the average of two output channels are 5% and 0.3 rad in rms respectively • Point source flux error after combining different baselines varies depending on source position away from the phase center. • Fractional flux error as seen in three annulus regions around the phase center are shown in the Table below. (Primary beam FWHM=22’) Extrapolation of Radio Sources • 6cm flux density given by PMN or BG6 catalog • 20cm flux density given by NVSS • 3mm flux density expected at 94 GHz • power index derived by fitting 1.4 to 4.85GHz (src-lead) On-Off Subtraction • Plots on the left demonstrate the two-patch subtraction. Before subtraction, each patch is dominated by pickup of the order of 20Jy/beam. After subtracting two patches, a source with -0.3Jy flux is revealed. • Plots on the right show another verification using lead-source-trail patches observation. The (src-lead) and (src-trail) maps clearly show detection of a source in the field center. The (lead-trail) map shows nothing significant in the center. (Green circle shows the FWHM of primary beam; blue shaded area indicates the synthesized beam) System Stability (src-trail) • Electronics were actively cooled but unregulated for the first few months of observation. System stability was susceptible to variation of ambient temperature. • Later temperature controls were added to correlator box, IF/LO module and 1st section of power division in that order. • Two plots below show the gain and phase of the system as checked by measuring visibility of Saturn and Jupiter for a whole night. (before temperature control) (lead-trail) Conclusion • 6 clusters were observed between Apr and Aug in 2007. • On-off subtraction removes most of instrumental and/or groun contamination. • Wide bandwidth and small number of lag is not a problem as long as data were properly calibrated. • Calibration interval of ~3hr were used based on system stability measurement. • Radio source contamination is expected to be low except for A2261.