Download
1 / 12
120 likes | 251 Views
UNECE – SECOND INTERNATIONAL FORUM ON TRADE FACILITATION GENEVA, 14-15 MAY 2003. COSTS AND BENEFITS OF TRADE FACILITATION Anthony Kleitz Trade Directorate, OECD. I. OBJECTIVE OF THIS PRESENTATION. Understand better the nature and importance of trade facilitation.

E N D
UNECE – SECOND INTERNATIONAL FORUM ON TRADE FACILITATION GENEVA, 14-15 MAY 2003 COSTS AND BENEFITS OF TRADE FACILITATION Anthony Kleitz Trade Directorate, OECD
I. OBJECTIVE OF THIS PRESENTATION • Understand better the nature and importance of trade facilitation. • Focus on a quantitative rather qualitative assessment.
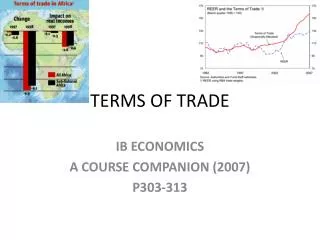
II. DEFINITIONS Trade facilitation (TF) – an imprecise term • WTO: simplification and harmonisation of trade procedures; • Often considered to include other procedural NTBs. Costs and benefits – not the flip side of each other • Trade transaction costs (TTC): what TF aims to reduce; • Implementation costs of TF; • Benefits of TF: come from the reduction of TTC; • Public and private sectors see different costs and benefits.
III. QUANTITATIVE ANALYSIS OF COSTS AND BENEFITS OF TF • Challenges: • Inconsistent data on TTC and implementation costs; • No standard methodology for analysis; • Results vary according to parameters and assumptions. • Public and private sectors face different costs and benefits. • Implementation costs for governments - an example of data for automated customs systems: • Chile – $ 5 m.; • Chinese Taipei – $ 5 m. (air-cargo system), $ 6.5 m. (sea-cargo system); • US – overall $ 1 b. (ACE estimate).
Modelling trade and welfare effects: • Overall TTC and benefits of TF: some results • TTC valued by UNCTAD at 7-10% of world trade; • Typically TF estimated to reduce TTC by 1-3% of world trade value, increasing GDP: Estimated Benefits of TF* * Liberalisation assumptions of these studies differ
Quantitative cost indications for particular sectors: Some goods more susceptible to border controls -- e.g. border delays for agricultural products: • Korea – typically 10-18 days for new products (cf. less than 3-4 days for most other agricultural products); • Japan – 1 day more for sea-cargoes subject to other government procedures (e.g. animal and plant quarantine, food sanitary).
3. Quantitative assessments for particular countries:Customs Service Quality in Relation to GDP Per Capita
OBSERVATIONS ON PERCEIVED QUALITY OF THE CUSTOMS ENVIRONMENT • “Customs service quality” is an average of three survey indicators; • SMEs and developing country firms frequently seen as disadvantaged in meeting TTC and implementation costs; • Positive correlation between income and customs quality; • Yet many examples of low-income countries with good customs services; • Examples of countries with good customs found in all major regions; • Suggests that benefits can be within grasp.
Calculations for particular kinds of costs and benefits: • Administrative costs: Japan MITI estimates feasible reductions of import prices: • 0.5-1.2% for transport machinery; • 1.5-2.4% for other machinery and equipment. • Savings from paperless trading: • estimated 1.5-15% of landed value by Australian DFAT; • 3% average $60b. savings across APEC. • Time required for customs release.
Average Customs Clearance Time for Imports through trade facilitation (Hours) Source: WTO, OECD, and others
IV. CONCLUDING REMARKS No single answer; work continues. Important to identify key areas where TF may produce greatest benefits. • One size does not fit all; • Importance of a coherent approach to streamlining procedures and improving infrastructure.